I had a few days off work last week which gave me the change to re-listen to the big idea that Kyle Bass proposed at the Delivering Alpha conference hosted by CNBC and available for replay on their website.
The idea presented by Bass was another “big short” (he made his name by being one of the few short sub-prime), this time on sovereign debt, but, uniquely, not on Europe. Bass is short Japan.
Now this is scary stuff. Japan is huge. Given that the disorderly default of Greece strikes fear in the hearts of fund managers, imagine what the disorderly default of Japan would be like. It is hard to imagine all the fall out.
The basic argument that Bass points out in his presentation is that Japan is in the very precarious position where even slightly higher interest rates will make them insolvent. And as Bass points out, we already have an analogue for how this situation goes from “everything is fine” to “Japan is insolvent” in a heartbeat, and that is Italy.
Thinking of the sudden change in perception of Italy reminded me of an email I wrote to a friend on August 5th, right about the time when things began melting down the first time because of Europe. I wrote: “A month ago I didn’t even know Italy had a problem. Now the country seems to be on a fast track to insolvency. Am I that out of touch?”
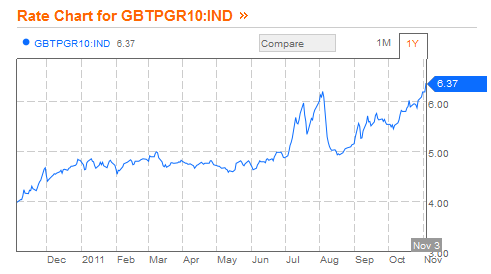
Well, it turns out I wasn’t that much more out of touch than anyone else, because that view was pretty much the consensus pre-summer view. And that is because before July, Italy did not have a problem. Take a look at the Italian 10 year. This morning it has jumped even higher – to 7.3%!

Before July, Italian yields was stable. Yields were below 5%, they had been for some time, and it could be extrapolated easily with a ruler that they would be for the forseeable future. But then July happened and at 6% the ability of Italy to repay its debt became an open question.
So why was did a 5% “everything is ok” interest rate turn into a 6% “OMG its a crisis” moment?
Looking at the Numbers
According to Italy’s Ministry of Economy and Finance, Italy’s outstanding debt is around E1.85B or USD$2.5t (2010 figure but Italy is close to a balanced budget so its probably nearly the same this year). Government revenues in 2010 were E729B or USD$950B. To do a little simple math then, every increase in the Italian rate of borrowing of 1% results in an eventual increase in borrowing costs for Italy of about $25B, or about 2.5% of government revenues.
In 2010 Italy paid E80B in interest expenditures. So right now the average interest rate that Italy is paying is about 4.3%. A 1% rise therefore raises the average interest rate to 5.3%.
The other relevant consideration is how quickly Italian debt comes due. In other words, what is the duration of outstanding Italian debt. I found the following excerpt from Morgan Stanley (are they still around?) that describes how quickly the impact will be felt:
Will an increase in interest rates of, say, 100bp be immediately reflected in the cost of servicing the debt? The answer is no. It all depends on the average maturity of the debt, which is roughly seven years in Italy. This means that it will take seven years for the cost of servicing the debt to fully reflect a 100bp increase in interest rates.
Taking all of this together, what it suggests to me is that the 1% move from 5% to 6% does not, in itself, put Italy in a dire predicament. Instead, I think that what has the markets concern is the trajectory. Italy hasn’t always been able to borrow at sub-5%:

Once the market starts to determine that you are on a road to insolvency, its pretty easy to get pushed on the fast track. In the case of Italy, 6% is starting to get closer to 7% every day. If yields rose 3-4%, then Italy would begin to have a problem with the interest that had to pay on their debt.
But the real reason I wanted to go through a study of Italy was because I wanted to use Italy, which is sort of the poster child of the big-country-government-profligacy, as a sort of baseline of Japan.
Japan is a Lot Like Italy, but its a Lot Worse
Japan’s net government debt is Y988t or USD12.3t at the end of the second quarter. Tax revenues collected by the Japanese government in 2010 were Y37t, or roughly about $500B in 2010. Doing the same math as we did for Italy leaves us with the incredible result that a 1% rise in the borrowing rate for Japan is a bit over $100B, or more than 20% of government tax collection.
To put this in an even starker light consider the following. Below is a table I made that shows the tax revenues collected by the Japanese government and the interest paid by the Japanese government over the last 20 years. Amounts are in millions of Yen.

Right now debt service is more than half of government tax revenues. In terms of the servicing costs of the debt, debt service was about 2% of overall debt in 2010, which as I mentioned above is Y988t.
To extend those two statements to a far more frightening conclusion, a doubling of the average interest rate the Japanese government pays on debt, which would be an increase of 2% across the board, and debt service jumps to well beyond government tax collection revenue.
So with a 2% increase in interest rates, Japan is done.
This is what Bass called in his presentation the “Keynesian endgame”. When your interest payments exceed your revenues, its game over for your government. Of course for all practical purposes, Japan is dead in the water long before a 2% increase because as soon as the trend is established, it won’t take much for investors to start doing the extrapolation.
Also, unlike Italy, Japan does not have a long duration on its outstanding debt to stave off the crisis once interest rates begin to rise. In fact, Japan has a notably short duration of about 6 years.
So far though, the market doesn’t care about Japan. Yields have actually fallen during the Eurozone crisis. As Kyle Bass pointed out in his presentation, he is getting sovereign CDS on Japan for only 100 basis points.

Of course the market also didn’t care much about Italy 5 months ago. Things change.
Why Now?
One of the questions that Bass fielded after he presented was by Leon Cooperman, who pointed out that the short-Japan trade has been a “widow maker” for years and asked why now? Why would Japan begin to run into problems now when it has been had the same unsustainable dynamic for years and the market has never cared.
The answer to that question, says Bass, lies in the change in the Japanese flow of funds that are available to purchase newly issued government debt.
The primary reason that Italy is considered a problem and Japan is not is that Italy requires foreign capital to fund itself. I think you can get a sense of how different Japan and Italy are in this regard by looking at the capital account of each country for their balance of payments. Keep in mind the chart is perhaps counterintuitive; a negative number translates as an excess of domestic capital going abroad (a financial outflow).

To be sure, the capital account is an imperfect barometer of what the actual magnitude of available capital is that can be invested in government bonds. For example, much of the capital going abroad from Japan is being invested in new and existing production by company’s with satellite operations. Its not available on demand to buy debt. Nevertheless, the capital account does demonstrate just how different these two countries are with respect to their dependence on foreign capital; a country exporting capital abroad is going to be less indebted to foreigners than one that needs an inflow of capital just to maintain their current level of consumption.
What Kyle Bass has done in his various presentations on Japan is refine the measure of available domestic capital in Japan to only include that which would reasonably be invested in government debt. And when you look at that metric, you notice there has been a bit of a sea-change of late.
Bass pointed out that the two sources of capital available to finance the deficit in Japan are private household savings and corporate profits. He summed this up as “national savings” in the chat below. Up until very recently, the debt issuance of the government (the red line) was less than the national savings of the country. Therefore there was more than enough domestic savings available to sop up the new government debt.
But this has recently changed.

It took me a while but I was able to verify his construction by creatingapproximately the same graph from public data. If you add the private residential and private non-residental savings (available here from the MOF) and then subtract the depreciation of existing assets from that amount it can be compared against the government debt issuance (available here)to create the same relationship as shown above.
A similar point has been picked up by some others. Notably, ftAlphaville ran a story a little over a year and a half ago where they referred to the work done by Dylan Grice of SocGen. Grice pointed out the specific case of the Government Pension Investment Fund, which demonstrates the general problem of “there’s not enough Japanese around to the buy the bonds we need to print”:
The biggest JGB holder on the planet – the Government Pension Investment Fund (GPIF) – which has already admitted it’s no longer able to roll maturing bonds, has announced that it will open credit lines so it doesn’t have to sell them to fund its obligations…
FT generalizes this to the following simple yet troubling point:
The obvious [point is] how household savings can continue to fund government debt and start retirement spending as Japan’s ageing crisis bites.
One might add that retiring folks in Japan are going to have a particularly tough time funding a retirement on 1% yields. They will undoubtedly be forced to dip into their principle.
When you look at the magnitude of the problem here; the amount of debt that Japan has outstanding, the sensitivity of the country to a small change in interest rates, and the demography that almost necessitates less capital being available for investment, it is a terribly ugly situation. It can’t end well, its just a question of how much longer it can go on.
And I still haven’t gotten to the scary part.
The most frightening part of the whole Bass presentation was his following comment:
I still have people selling me risk, 23 year old kids in investment banks, selling me five and a half billion clips of risk for one and a half basis points. This is hundreds of billions of dollars of AIG happening again in the sovereign space.
This just struck me as so eerily reminiscent of 2008. I mentioned in an earlier post that I had just finished reading The Big Short for the second time. What fools are selling Japanese default insurancein the same way the subprime mortgage insurance was sold? Keep in mind that if you are selling it for one and a half basis points you will need to sell a lot of volume to make it worth while.
And some day its all likely going to blow up.
That is going to be an ugly day on the market.
Appendix
http://fundmanagernews.com/short-japanese-bonds
http://ftalphaville.ft.com/blog/2010/03/08/167701/japans-brewing-fiasco/
http://www.economywatch.com/economic-statistics/country/Japan/
http://elibrary-data.imf.org/DataReport.aspx?p=1449284
http://www.tradingeconomics.com/japan/government-budget
Japan: How bad is the fiscal mess?
http://www.business-standard.com/india/news/martin-feldstein-japan%5Cs-looming-savings-crisis/409620/
http://ftalphaville.ft.com/search?q=japan&p=9
http://www.mof.go.jp/english/budget/statistics/201006/index.html
http://www.planbeconomics.com/2011/05/12/dylan-grice-japan-tax-revenues-no-longer-cover-non-discretionary-spending/
http://fundmanagernews.com/short-japanese-bonds


