Skip to content

Archive for

Golden Star Resources: Betting against a history of disappointment

I have been slow getting to this write-up.  My plan was to write about how Golden Star had drilled a number of holes that extended the depth of their Wassa underground by 180 meters, that this would add a lot of resource to the mine, and that it was not priced into the stock.

But Golden Star beat me to the punch with this news release Friday.  The company announced that they had doubled the inferred resource at Wassa, adding 3.1 million ounces for a total of 5.2 million ounces.

The next step will be further infill drilling to upgrade the resource to measured and indicated, and a preliminary economic assessment of the extensions.

So that took some of the wind out of my sails.   The near-term story I was going to tell was kind-of squashed.  Nevertheless the big picture story is by no means finished.  In fact I think Golden Star is just getting started along a path to credibility.  I’m hopeful that the destination is growth, and a valuation in-line with other gold stocks.

History of Disappointment

Golden Star Resources has always been a very cheap gold stock.  The problem has been that this was well-deserved.

I’ve watched the company on and off for years.   They have always been one of the highest cost producers.  Cash costs typically exceeded $1,000/oz. This is what cash costs and all-in-sustaining costs (AISC) looked like from 2013 to 2015:

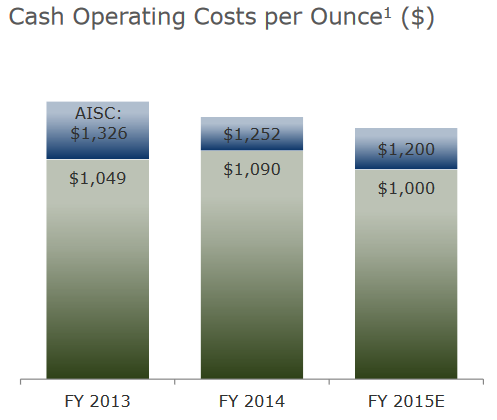
These kind of numbers made them bottom quartile in costs.

But that’s changing.  In the last two years Golden Star has gotten their costs down. With the transition to underground operations at both of their mines (Wassa and Prestea), costs are expected to come down even more.  ASIC in 2018 are expected to be between $850-$950/oz:

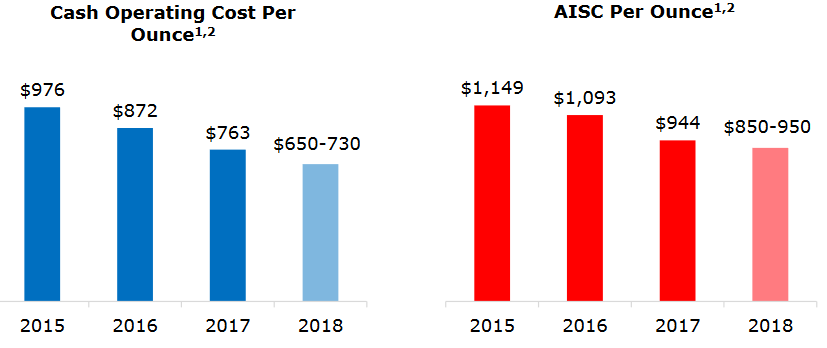
These new numbers don’t put Golden Star in the high cost bracket any more.  They are in line with the majority of producers.  Here is a brief list of other companies where estimates range from $850-$950/oz AISC or higher for 2018: Acacia Mining, Argonaut Gold , Detour Gold, Eldorado, IAMGold, Kirkland Lake, Klondex, Lea Gold, New Gold, OceanaGold, SEMAFO, Teranaga Gold, …  you get the picture.

While costs are trending towards the average, the valuation has not.  Golden Star trades at less than half the price to cash flow multiple as these other names.  If you start to factor in the potential growth it looks even cheaper.

So why the disconnect?

I think its just years of disappointment.  The market needs a lot of proof before they will re-rate the company.

Wassa and Prestea Underground

The bet here is that things are changing.   Golden Star has two underground mines that are ramping up, a tonne of exploration prospects both within these mines and in the surrounding land base, and the capacity to grow production within their existing asset base using little additional capital.

Golden Star operates two mine complexes, Wassa and Prestea.

Both of these mines started off mainly mining open pit ore but are transitioning to underground.  Wassa is ahead of Prestea, having begun underground production in early 2017.  Wassa has been ramping up since and is performing well.

I think that one of the problems Golden Star has had is that reserves for both Wassa and Prestea underground are limited.  Mineral reserves for Wassa are 742,000 ounces which they say is about a 5 year mine life.  Similarly Prestea has reserves 463,000 ounces, which works out to a 5.5 year mine life.

I’m not sure why the reserves at these mines is so limited.  Some of it is that underground mines often have smaller resources because drilling out too far ahead of the mining activities is expensive.  Golden Star has been hanging on by a thread for years, so these were likely costs they chose to to incur.  I also get the impression that there have been stability issues at Prestea that have only recently been corrected and allowed more drilling to take place.

While reserves are small, there is a much larger inferred resource for both mines.  With Friday’s press release, the Wassa inferred resource is up to 5.5 million ounces.  Prestea has 800,000 of measured and indicated and 868,000 ounces of inferred.

The small reserves and large inferred resource present an opportunity.

When you look at analyst estimates they, quite rightly, are basing their net asset value calculations primarily on known feasibility studies and preliminary economic assessments.

Take BMO for instance.  They have an NAV5 for Golden Star of $1.04.

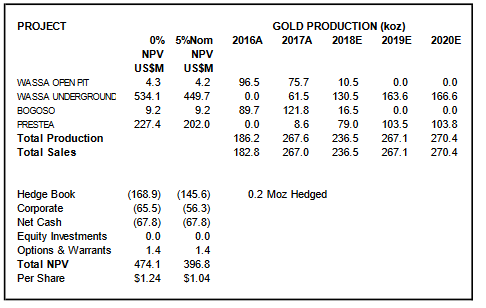
I can reverse engineer that number (like I’ve done below).  To do so, I back-out total production from Wassa of a little over 1,000,000 ounces and 471,000 from Prestea (both the NAV0 and NAV5 match reasonably well, so I think I’m on the right track with these numbers).

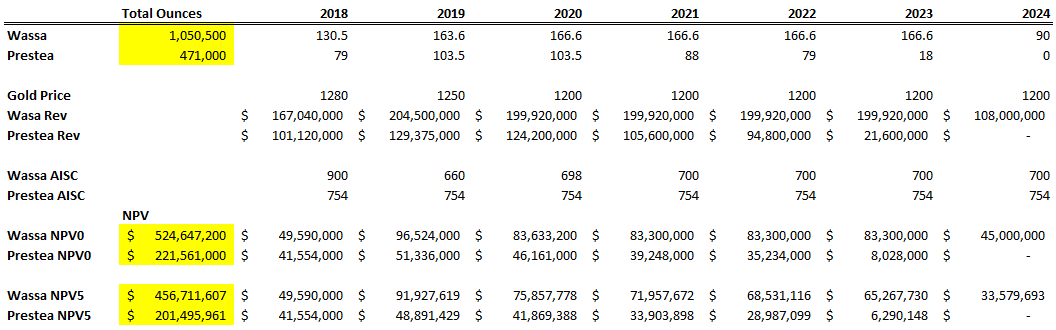
Wassa has 5,000,000 inferred ounces.  Prestea has 1,600,000 measured, indicated and inferred ounces.  Very few (in the case of Wassa) to none (in the case of Prestea) of these ounces are included in the net asset value.  The inclusion of these ounces, if the company can successfully prove them up, represents a lot of upside for the stock.

What’s more is that Golden Star can add significant production within its existing mining infrastructure.  They have built their mine and milling capacity with expansion in mind.  The mine at Wassa has capacity for 4,000 tpd while the mill can handle up to 7,000 tpd.  At Prestea its even higher, with the mine at 1,500 tpd and the mill at 4,000 tpd.

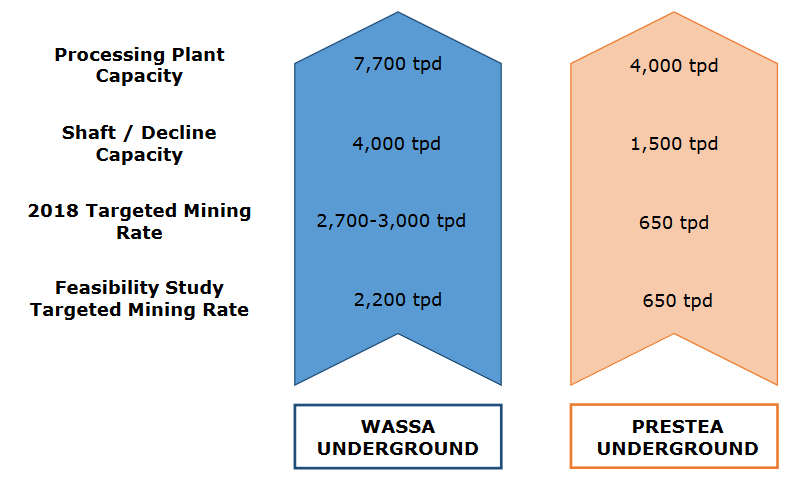
Wassa could easily expand its mine rate by 30% before having to expand the shaft and decline.  Prestea could more than double production before having to do so.

What this means is that if Golden Star is successful in turning inferred ounces into reserves, the cost of bringing those into production will be minimal.  They should be able to ramp to double their current production without having to put out a lot of capital.

First Quarter Results

Golden Star provided first quarter production numbers on Wednesday night.  Wassa exceeded the expectations of most analysts, producing 35,506 ounces at 4.54g/t grade.  Grade had been an issue during the ramp of the underground at Wassa.  In the third quarter grade averaged 2.6g/t, well below the 4g/t feasibility grade.  The fourth quarter improvement to 4.04g/t, followed by this latest news is evidence that Wassa is on track.

The Prestea underground is earlier in the ramp.  The mine just reached commercial production (defined as 60% of capacity) in February.  They are having problems typical to a new start.  In the first quarter they were only producing from a single stope, and the models of that stope were a little off the mark, which led to more dilution (lower grade).  They say they’ve reviewed the stope model, figured out what was wrong with it, and expect better grades when they start mining a second stope in mid-April.

The second and third quarter numbers will have to be watched carefully for progress from Prestea.

Exploration

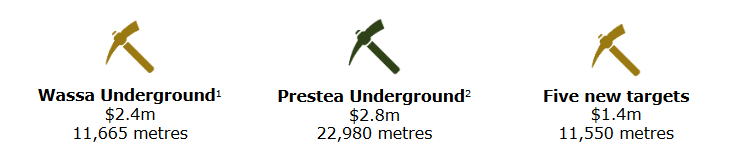
Apart from getting Prestea up to plan, the big news will be exploration results.  The company  is spending $6.6 million in 2018, split between Wassa, Prestea and new targets around the Prestea and Wassa complexes.

The drilling at Wassa will be focused on filling in the areas between existing drill holes. In the section below the pink area represents the original 2,000,000 ounce inferred resource.  The step out to 18900N is where they drilled the extension that added another 3,000,000 ounces.  You can see the large gaps that need to be filled to clean up the resource.  Doing so will upgrade the inferred resource to measured and indicated and to reserves.

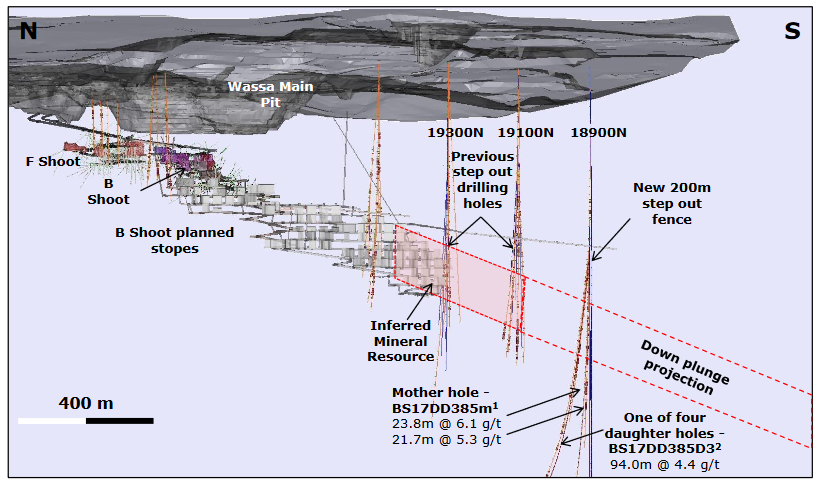
To facilitate drilling they have created an exploration drift extending from the mine to facilitate the drilling.  I believe this is the line extending from the mine to the north just above the pink inferred resource box in the map above.  Therefore the drilling meters planned at Wassa are a little deceiving, because they can drill a lot more holes from closer to the ore from this drift, so I expect them to accomplish a lot in those 11,000m they have planned.

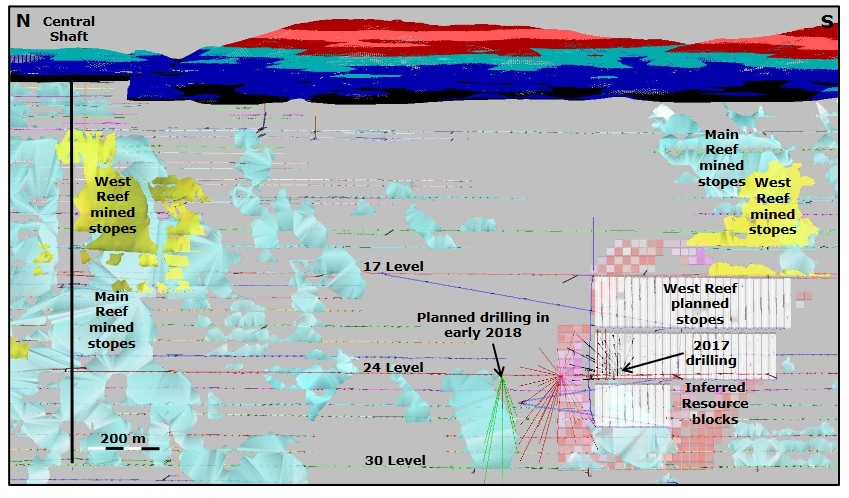
The opportunity at Prestea is a little less clear.  Prestea is about a year behind and so the company is just now starting to evaluate how they might expand production in the coming years.  Drilling this year will infill the existing inferred resource and more importantly focus down plunge on the West Reef (the green lines are the drill holes).  Good results there will add new resource that could expand operations at the mine.  Prestea is very high grade (14g/t or so) and the mill only operates at 600 tpd, so it doesn’t take a lot of new ore to add significantly to the mine.

There are a few other exploration prospects that Golden Star will spend about $1.4 million on in 2018:

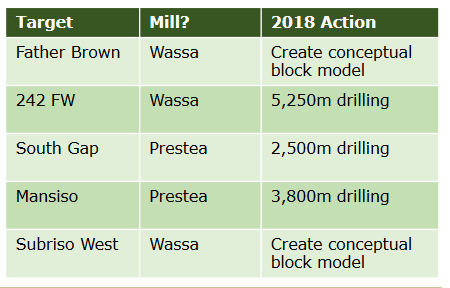
All of these are quite early stage and I don’t know much about them yet.  The most advanced appear to be Father Brown and Subriso West, which have a combined inferred resource of 476,000 ounces.  Father Brown has an underground grade of 6g/t which sounds promising.

Conclusion

Friday’s price action not withstanding, I’m not expecting an overnight success with Golden Star.  It is more likely to be months of positive results that slowly build back the company’s reputation.

But I think that the outcome will be worth it.  Especially if gold prices can stick to the current $1,300 level or move higher.

The BMO estimate I pointed to has an NPV5 of $1.04 USD on the stock.  Even after Friday’s move, that’s a significant discount to the current price of 66c.  That estimate is done at 2018 gold averaging $1,280, dropping to $1,200 in the long term.  It includes minimal tonnage from Wassa and Prestea exploration.  It includes no ramp of production to 4,000 tpd at Wassa or 1,500 tpd at Prestea.  So there are lots of ways that number can move higher.

It’s a simple play.  Cheap on comps, cheap on net asset value, a good chance to ramp significant growth over the next couple of years, and in a commodity environment that, in my opinion, is more likely to go up than down.

Sonoma Pharmaceuticals: A Simple Bet on Rising Revenues

Note: I wrote this post up a few days ago but kept postponing the final edit.  In the mean time this news came out (this morning).  I haven’t really dug into it yet, I’m not entirely sure if this is a brand new product or a gel reformulation of their existing scar treatment product.  But anyways, its constructive to the story as they added another product for their sales team to sell.

On to the post.

I’ve had Sonoma Pharmaceuticals on my watchlist for a couple of years now.   I hadn’t paid it much attention, but I saw a couple of articles about the stock on Seeking Alpha over the last 6 months (here and here) and they kept me watching the stock.  They were interesting, but not compelling enough to buy.

More recently when I saw that Daniel Ward had been accumulating a large position I got more interested.

Still I waited.  I saw the company was short of cash and there would probably be a raise coming sooner or later.  When that day came, I took a position.

Capitalization

After the capital raise Sonoma has about 6 million shares outstanding.  At $4 that gives the company a market capitalization of $24 million.

There are a bunch of warrants and options outstanding but they are well out of the money.  There are 1.3 million warrants priced at between $5 and $6.50.  There are another 1.4 million stock options priced on average at $12.

The company has no debt and after the recent share offering closes they should have about $13 million of cash.

Burning Cash

Sonoma is not a profitable company yet.  They burn cash.   They are using about $2.3 million of cash each quarter.  With the recent raise they would have enough to get them through 5-6 quarters at the current burn rate.

I think they are going to start using less cash as time goes on.  The company has been growing its dermatology revenues like a weed.  If this continues then they should close the gap to break even over the next 18-24 months.

Hidden Growth

Sonoma operates 3 segments.  Only one of these segments is growing quickly.  The growth is hidden by the other two slower growing segments, and by poor comps created by the prior sale of other businesses.

In October 2016 Sonoma sold its Latin American business for $19.5 million.  The business made up 30% of revenue at the time.

As part of the agreement, Sonoma agreed to continue manufacturing the products sold until Invekra S.A.P.I. de C.V. of Mexico establishes their own facility.  Gross margins on this manufacturing business are only about 6%.

The consequence has been a double whammy. The revenue comps have looked bad because of the revenue loss.  And margins looks bad because of the manufacturing agreement.

They also have a lower margin, low growth international business.  They sell both dermatology and animal health products through this segment.

To be honest, there isn’t a lot of information on the international business.  I know that in general they sell their derm products abroad and the list of countries is long, but I haven’t been able to pin down where sales come from and which products are the drivers.

The international business is expected to grow modestly going forward, in the 5-10% range.

The High Growth US Dermatology Business

Sonoma sells 6 products in its US dermatology segment.  The four established products (Ceramax, Mondoxyne, Celacyn and Alevicyn) have shown significant sales growth over the last couple of years.

Overall U.S dermatology has been growing like crazy.  Year over year gross revenue (before returns and rebates) was close to 100% in the fourth quarter.

The growth has been due to both price increases and script increases.  Below is script growth for each of the 6 products over the last few years.

I’m going to dig in a bit further to each of these products next.

Celacyn

This is a prescription hypochlorous acid-based scar management gel.  It softens, flattens and reduces the redness of scars.

Sonoma launched Celacyn in the fall of 2014.  There are only two prescription scar treatments on the market.  The other product is RECEDO.  Sonoma estimates that the market share is about 60/40 in favor of RECEDO right now.

The company has talked about how the scar market is a big market.  While I couldn’t find a number for the total addressable market (TAM) applicable to Celacyn, the global scar market is extremely large, at $16 billion and growing at a 10% annual rate.

I also found a quote from the company saying that the addressable market for Celacyn is “62 million scars formed annually”.  So the TAM is big.

According to this paper, the scar management market is seeing acquisitions.  In March 2017, Hologic Inc., announced the acquisition of Cynosure Inc., to expands its business in medical aesthetic market.  The acquisition was at 3.3x sales.

Prescriptions of Celacyn were pretty flat last year.  But the company has been putting through price increases which has brought sales up.  Based on company data (which I believe comes from teh Symphony database) the average price per script was $200 in Q4 2017 vs $133 in Q4 2016 and $102 in Q1 2016.

According to this blog post, which admittedly is a couple of years old, Celacyn at the time was “the low cost provider compared to competing products sold for wholesale acquisition cost (WAC), or the price paid by the wholesalers, in excess of $200 and ranging up to $800.”  Just from a few Google searches, it looks like RECEDO retails right now at $314 per bottle.

So I’m going to say the move to $200 per script is just catching up and the company has saw better leverage to price then volume over the past couple of years.

Ceramax

Ceramax manages skin irrations, rashes, and inflammation.  It is FDA approved as a “skin barrier repair product” for eczema and atopic dermatitis.

Sonoma launched Ceramax in May 2016.  It was an acquired drug (US License) from the Lipogrid Company of Sweden.

Sales have had a bit of an uneven trajectory.   Scripts jumped from 1,908 to 2,382 yoy in the fourth quarter. But in the third quarter sales were down year over year, from 1,410, to 2,12.  Still its a new product, and the trend is clearly up.

There has also been price increases.  When they launched in the second quarter of 2016 Ceramax, the average price was $225 per script.  That has increased to $314 per script in the fourth quarter.

Sonoma seems pretty optimistic about the outlook for Ceramax.  In the last call they said:

Ceramax was our fastest seller in December due to several factors. First, Ceramax has the highest concentration of ceramides, fatty acids and cholesterol that our skin craves, on the market today. Second, everyday dermatologists see patients with inflammatory skin diseases and every inflammatory skin disease patient has disrupted skin barrier in some way, shape or form. We think the sky is the limit with this product. Third, we have a great rebate program for Ceramax, meaning, we go out of our way to make it affordable to every patient. And then finally, the winter months in North America bring on winter itch and Ceramax has great clinicals in addressing itch.

To some degree its a seasonal product, so we should expect sales to trend down in the first quarter.

Its tough to get an exact figure on the market size because all the reports are expensive and I’m not paying $4,000, but its easy to glean that ballpark, its a big market.  According to one older study I found, globally the market is around $800 million with the US accounting for $600 million of that market.  I’ve seen estimates suggesting it could grow to over $2 billion by 2021.

Mondoxyne

Mondoxyne is a prescription oral tetracycline antibiotic used for the treatment of certain bacterial infections, including acne.  It works by slowing the growth of bacteria which helps the immune system catch up.  The sell it in 50mg, 75mg and 100mg bottles.

Mondoxyne is a cheap alternative to other brands.  This post says that Mondoxyne is similarly priced to generics and far below branded products.

Sonoma acquired Mondoxyne in 2015.  Since that time they have had a lot of success growing the brand.

Quarterly scripts have increased from 222 in the first quarter of 2016 to 1,733 in the fourth quarter last year.  Price growth has been very modest, and prices actually appear to have declined from $595 to $459 sequentially in the fourth quarter.  I’m guessing this would be due to mix, selling more 50mg bottles?

Alevicyn

Alevicyn is a prescription hypochlorous acid based atopic dermatitis product line.   It reduces itch and pain associated with various skin conditions.

Alevicyn is the their largest revenue product.   Revenue was up from $1.1 million to $1.6 million year over year in the fourth quarter, or about 50% growth.

The growth is coming from unit growth, up 17% year over year in Q4, from 4,204 to 4,930, and from price increases.  Using Sonoma’s data I estimate that the price per script was $100 in Q2 2016, rising to $150 in Q4 2016 and to $200 in Q4 2017.

Much like Celacyn it appears that the price increases are just catching up to the competition.  On the August 2017 call the company said:

“Our price per gram of product is currently well below that of our competitors. For example, Topicort, a solid branded mid-potency topical steroid for the treatment of atopic dermatitis, sells for $4.50 per gram; a comparable generic sells for $2.67 per gram; and our Alevicyn gel sells for $1.11 per gram”

In many cases Alevicyn competes against corticosteroids that go for $100 to $800 per script.

In November and December, the FDA approved expanded antimicrobial language for Alevicyn.

According to this report from Stonegate capital, the addressable market for Alevicyn is between $500-$600 million.

Sebuderm

Sebuderm is a prescription topical gel used as an alternative to corticosteroids for the management of the burning, itching and scaling experienced with seborrhea and seborrheic dermatitis.

Sebuderm was launched just over a year ago and scripts have been growing significantly.  In the fourth quarter scripts were 1,206 up from 948 the prior quarter.

There is not a lot on the size of the market, but Sonoma did say that “25% of the general population has seborrheic dermatitis” earlier this year.

Worth noting is that in the same press release Sonoma commented on the products efficacy.  They announced the results of a study that showed an improvement in appearance and symptoms “from baseline was 33% at day 14 and 52% at day 28…[and] 62% through day 28.”

Loyon

Loyon is a prescription liquid for managing erythema, itching for seborrhea and for seborrheic dermatitis.  They have some pictures in their last presentation showing Loyon being used on peeling skin around the hairline, where it clears it up after about 7 days.

Loyon is the most recent launch.  It was launched in September after receiving FDA approval in March.

Loyon can also be used for psoriasis but it isn’t approved yet.  They are in the queue requesting approval from the FDA.  On the last call they said:

In Europe, it’s currently being sold in Germany and the U.K. for broader indications than we got in the U.S. to start. They have a psoriasis indication in Germany and the U.K. We took their clinical data, got back into the FDA queue and it is very, very compelling clinical data. So we have our fingers crossed that we’ll get that. Bob, are we saying within the next 12 months?

Loyon is already widely used in Europe.  They bought the US license for the product from a German company.  On the fiscal second quarter call they said that European sales (in Germany in the U.K) are about $10 million.  In Europe Loyon is approved for psoriasis.  In the US its competing against two older legacy products.

Breakeven

Sonoma does better than average job of explaining what it will take for the company to reach break even.  On slide 25 of their February slide deck, they show where they are now on a per salesperson basis and where they need to get to in order to break even.


Increasing the number of prescriptions per sales rep is not as daunting as it appears.  Last May CFO Robert Miller said that the more experienced 17 sales reps that had been with company 1-2.5 years did around 815 scripts per quarter.

With new products and extensions added since that time, getting all 30 reps up to 900 scripts per quarter should be an achievable task.  At least that’s what I’m betting.

To help growth they have been trying to add a new product or line extensions every six months.  In the fourth quarter of 2017 they launched Loyon.  In early 2018 they have new line extensions for Ceramax.

The rest of the increase is going to come from price increases and mix improvements.  From the above table it looks like Sonoma is betting they can raise the average net per script about 30% from the last quarter’s average.

I’m less certain about how easily they can do this.  There is evidence anecdotally that many of their products are cheap compared to the competition.  But I have a difficult time knowing when they hit the ceiling on price increases.

Sonoma also provides a detailed rundown of what it will take for company wide break even on the following slide of their presentation.

The key number is the $4.158 million of net revenue.  Sonoma grew the US dermatology segment at 78% year over year last quarter.  The quarter before that was 53%, and before that was 74%.

Presumably they are going to see growth slow as the initial ramp from the new reps begins to level off.  Nevertheless, I am willing to bet they can reach breakeven in about 8 quarters.   That would require year over year growth of net revenue from dermatology (assuming no growth outside of derm) of 40% on average.

Conclusion

With a market capitalization of $24 million, cash of $13 million and their derm segment growing at 50-70% I am betting Sonoma has bottomed.

I think that we are inflecting to where derm is big enough to overwhelm the lower growth segments.  And where the market starts focusing on this growth more than the cash drain.

I’m also betting that as the company gets closer to break-even, they can get revalued more conventionally on a revenue multiple.

I mentioned above this research paper, which noted that scar management  “has been experiencing a number of acquisitions and collaborations”.  They point to the acquisition of Cynosure by Hologic, which was acquired at an enterprise value of $1.4 billion, net of cash.  This works out to 3.3x sales.

Sonoma trades at 0.6x revenue including cash.  Looking at some similarly sized competitors, Novabay Pharmaceuticals trades at 3.3x revenue and grew revenue of their only product, Avenova, at 50% year over year.

Novabay used $3.3 million in the first 9 months of the year.

Novabay seems like a particularly good comparison because the stock moved from $2 to $4 as the company demonstrated growth and began to close the gap to break even.  I think Sonoma is in a similar spot to that now.

I have owned Novabay in the past and followed the company for a couple of years now.  Using that experience as a roadmap, the trajectory for Sonoma is going to entirely depend on quarterly revenues going forward.  If the company can maintain its growth momentum the stock price should do well.

Even tiny competitor Wound Management, which grew revenues 14% year over year in 2017, trades at 1.2x sales.

It will help that analyst estimates for the company are not that aggressive.  Revenue for next year is expected to come in at $19 million which is less than 10% overall growth.

For the next quarter (fiscal Q4) the average estimate is $4.49 million.  The fiscal fourth quarter is always seasonally down from the previous quarter.   Backing out the derm numbers from the first quarter forevast implies expectations of about $1.7 million from dermatology sales.  This would be a 41% year over year increase and a 40% sequential decrease.

This doesn’t seem like a high hurdle.

Bottomline Sonoma is a pretty simple bet.  Beaten down and bottomed out.  Continue the sales momentum and bridge the gap to breakeven.  Hopefully if that happens the stock gets revalued closer to 3x revenue.