Skip to content

Archive for

Nimble Storage as a Bet on a Successful Pivot to All-Flash

I’ve been dragging my heels on a Nimble write-up.  I knew I would have trouble with it.   I have a thesis, but I’m not entirely convinced of it, and I don’t feel like I have a really firm grasp of the industry they operate in.  So I’m not in a position to write anything very definitive.

What would accurately summarize my thoughts is to say that I think that Nimble may go a lot higher if things pan out.  I think the downside is fairly low (maybe 20%) and the upside is high (maybe a double).  And while I really don’t have a ton of conviction that events will transpire positively, the risk/reward makes it worthwhile to me.

Nimble sells flash memory.  Flash memory has replaced hard disk drives (HDDs) as the preferred technology for persistent (meaning that the data persists when devices are powered down) storage.   Flash has much faster read and write capabilities than HDD storage.  Its primary disadvantage has always been cost, and that has narrowed as the technology has been refined.

Nimble has historically sold a version of flash memory called hybrid flash.  Hybrid flash means they are not just selling flash, they are selling a combination of HDD storage and flash storage.  For a number of years hybrid flash bridged the gap by providing some of the speed improvement of a flash array but without all the cost.

At the most basic level, hybrid storage works on the read side by keeping the most commonly accessed data in the flash and the less accessed data in the HDD.  On the write side, the flash is used as a buffer that gives the appearance of speed as long as write loads are not too heavy.

This Youtube video, which is ostensibly about Nimble’s operating system, provides a good explanation of how hybrid flash works. It also explains some of the tweaks that Nimble’s hybrid flash incorporates to speed up performance even further.  Nimble’s hybrid flash is considered top of the line.

Slowly, technology improvements and cost reductions have been made to flash arrays that have improved the cost/benefit equation enough to justify complete replacement of HDD storage in some of the heavy use applications (referred to as primary workloads).  When a storage system uses nothing but flash memory it is called all-flash.  The acronym AFA, which is the commonly used terminology in investment reports, stands for all-flash array.

Adoption of AFA’s has happened much faster than had been originally predicted by analysts.  Below is a slide from a Solidfire/Netapp presentation that was given at NetApp’s analyst day.  The red line represents analysts average estimate of how quickly AFA storage would be adopted.  The blue data points are the actual product adoption for NetApp.


BMO indicated in a research piece they did on Nimble (I can’t link to it but I can get it for anyone who sends me a note about it) that the AFA market grew at 88% in 2015 and was 11% of the flash market at year end.  BMO expects compound growth of 22% from 2015-2020 at which point AFA will be 70% of the market.

There are only a few major players that provide All Flash arrays.  The main one’s are Dell/EMC, Pure Storage, NetApp and HP, as well as a few private start-ups.

Nimble was late to the all-flash party.  They have only had an offering since the second quarter of this year.  The stock took a tumble in the third quarter of 2015 after investors realized that the growth trajectory of a hybrid flash business model was broken and that it would take time (and have risk) for Nimble to shift its resources to All-Flash.

stockprice

Since that time Nimble stock has struggled as the company has repositioned itself as an all-flash player.  There were poor results as they developed their all-flash offering,  and growth from the new all-flash product hasn’t met expectations.  There is also the turnover of a disgruntled shareholder base, which may be a bigger factor than any operating concern.

But the company is making progress.  While the stock tanked after they released third quarter results, they did show growth.  Revenue increased by 26% year over year.  All-flash grew at about 30% quarter over quarter.

The negative perception around the results is in part because competitors have been growing as fast or faster off of a larger base.  NetApp reported 185% year-over-year growth in the third quarter, while HP reported 100% year-over-year growth.  Pure Storage, which reported results in December, showed 93% year-over-year growth.

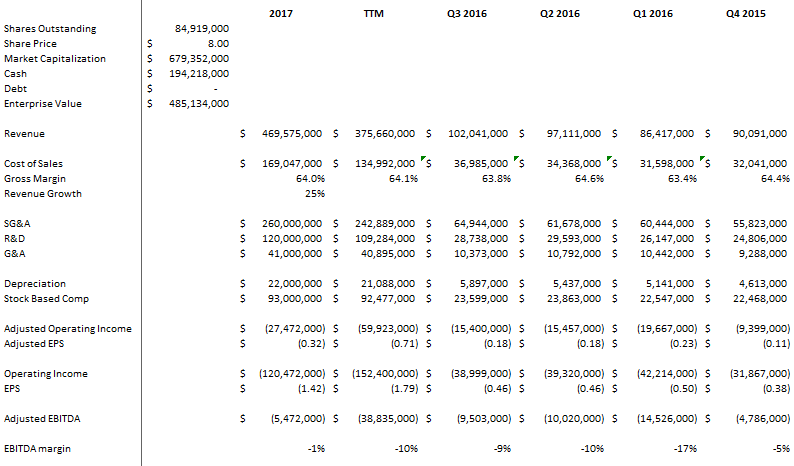
The other part of the negativity is concern around when the current growth rate will lead to profitability.  If you model out Nimble’s earnings assuming a continuation of 25%-ish growth, it’s 2018 before the company becomes profitable on an adjusted basis.  It’s even longer if you factor in the very large stock compensation expense.

forecast

I bought Nimble because I think there is a reasonable chance that growth accelerates in the coming quarters.  Nimble has a few things working in its favor.  First, by all accounts their All-Flash product is as good or better than the competition.  In fact I came across Nimble after hearing industry contacts raving about the new all-flash product.

Second, they have their legacy, complimentary, hybrid flash product that they can sell along with the all-flash.  While high end workloads are moving to all-flash, secondary workloads are still better served by a cheaper hybrid storage.  Nimble is a leader in hybrid and can offer both options. Other competitors, like Pure Storage, cannot.

Third, the company has a large existing customer base that they can tap.  They had almost 9,500 existing customers at the end of the third quarter.

Fourth, Nimble is just starting to go after bigger accounts.  In their third quarter release they said that “bookings from large enterprises (Global 5000) grew 53% and bookings from Cloud Service Providers grew 65%”.  I suspect that some of the early disappointment in all-flash growth is attributable to the process of gaining traction in these larger accounts.  If the company’s product is as good as it seems to be, this will correct itself over time.

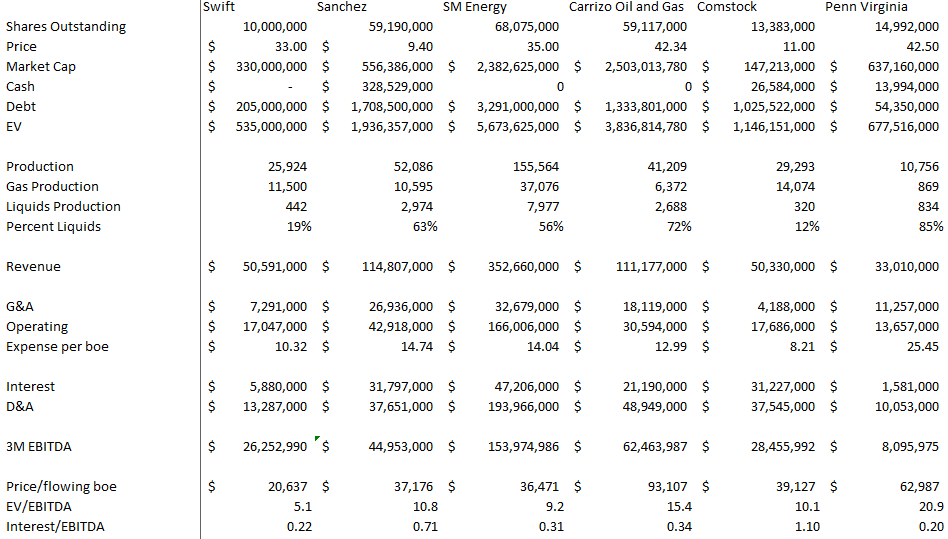
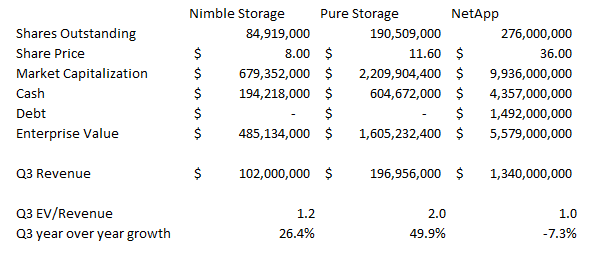
At a $8 share price, Nimble has a market capitalization of $680 million and an enterprise value of $480 million.  Given the growth rate of the overall business, I think this compares favorably to peers:

comp

The idea here with Nimble is a bit reminiscent of Oclaro.  When I looked at Oclaro in the spring the stock was trading at $4.50, it had kind of a crappy history, a depressed shareholder base, but was beginning to see some secular tailwinds at its back from the 100G ramp.  It was well positioned with 100G products to take advantage of that tailwind.  It appeared to have decent growth on the horizon, yet if you modeled out that growth based on analyst assumptions it still was a long ways from profitability.

Yet what happened with Oclaro is that growth took off.  The stock doubled.

That is what could happen to Nimble.  The product is there, the tailwind is there, certainly the crappy past and depressed shareholder base is there.  There’s no guarantee it happens, maybe growth sags into the teens and profitability remains distant on the horizon.  But if it does happen I think the stock does much the same thing Oclaro did.  So it’s worth a position.  And an add or two along the way as the thesis plays out.

Third Quarter Updates: Versapay

It’s getting a bit late in the game to be writing up third quarter results so this will likely be the last one I do.  But I did want to say a few words about Versapay, because they announced additional divestiture news at quarter end and have an interesting white-label deal for ARC in the works that could be meaningful to the share price.

Versapay announced their third quarter results on November 29th.  At the same time they announced that they had sold their Merchant Services business for $10 million up front and another $1.5 million contingent on performance.

$10 million represents about 5.5x EBITDA for the business.  While Merchant Services grew pretty strongly in the third quarter (15% year over year) historically the business grows at only around 5%.  With the sale Versapay is basically pulling forward their cash flow for the next 4-5 years. This isn’t a bad idea since they need that cash flow now to fund their burgeoning online business.

What the sale leaves is Versapay Solutions, which consists of their cloud based accounts receivable platform ARC.  Versapay accelerated customer acquisition onto the ARC platform in the second quarter, as customer count increased from 43 to 70.  In the third quarter the increase moderated to 76 customers, which was a disappointment.

arc_metrics

The company gave the usual explanation of temporary delays, but unlike so often when the excuse is offered, in this case it may actually be true.  Since the end of the third quarter through mid-November the client count increased another 10 to 86, and active customers increased to 29,000.  So it appears that growth is re-accelerating.

Revenue at Solutions grew to $400,000.  All revenue at Solutions is recurring so the business is up to $1.6 million in annually recurring revenue.

solutions_revenue

What the sale of Merchant Services makes clear is the valuation the market is assigning to ARC.  At $1.20, Versapay has a market capitalization of around $36 million.  With the cash from the sale, total cash will be around $13 million.  So after generously deducting the existing cash, the enterprise value of the company and valuation of ARC is around $23 million.  For that price you get $1.6 million of recurring revenue growing at a 75% year-over-year rate.  The conclusion I would draw is that the stock price is probably fully reflecting the current trajectory.

What could buoy the valuation is the channel partners that Versapay is cultivating.  On the conference call they went into some detail about the type of channel partners they are trying to secure:

  1. Referral partners such as ERP vendors. The relationship with NewsCycle is an example of this.
  2. Business process outsourcing companies looking to embed ARC into to their product offerings. Subsequent to the end of the quarter Versapay signed one of these deals with Ricoh
  3. Financial institutions looking to white label the product

It’s the third group that has the biggest near term opportunity.  For the last number of months Versapay has been working with a Tier 1 Canadian bank (who they haven’t named yet) on a white-label launch of ARC for the bank’s customers.  On the conference call Versapay said they had now developed a “single sign-in integration with the banks online site” and that they expected to launch “a bank branded version of ARC at the beginning of December”.  The banks sales reps were already out in the field selling to customers.  The banks goal is to secure 10 customers as a pilot program.

If this takes off the opportunity is very large.  The bank has said to Versapay that they estimate they have 100,000 business customers are a good fit for ARC.  Compared to the current customer count, which is less than 100, securing a fraction of the addressable market could launch Versapay to another level.  I haven’t seen anything about the economics of their agreement to white-label ARC to the bank.

I’m holding my stock, and I have added a little over the last few months.  When they announce the bank relationship in more detail we probably will see a pop.  Its not a cheap stock but if the customer count can move exponentially from the banking white-label (assuming the company is getting reasonable terms) I don’t think the market will care.

Third Quarter Earnings Update: Empire Industries

I’m catching up on a few of the later quarterly results that came out.  Empire Industries was typically late with their results, which came out on November 29th.  They were mostly a non-event.

The company is in transition.  Up until this year the primary business unit of Empire, Dynamic Attractions, developed custom amusement park rides.  Their rides are high end, technologically complicated rides like the Harry Potter & the Forbidden Journey attraction.

In the last year they have transitioned their Dynamic Attractions business model from customer attractions to standard products that they can sell to multiple park operators.  The transition is expected to improve margins, as they focus on more of a manufacturing process than on one-off creations.  So far though it has not.

eilpost1

On the call CEO Guy Nelson said that they expect to be mostly through these growing pains by2017.  He pointed to the Flying Theatre, which I believe was the first standardized product.  They’ve sold 10 Flying Theatres so far, and the last nine have been at much better margins than the first.  As more products get over this hump, margins are expected to improve.

With the spin-off of the hydro-vac business (which I have written previously about here), the other remaining business unit for Empire has been steel fabrication.  Nelson said that they will be changing the direction of the steel fab business, exiting the contract manufacturing business and focusing it on producing parts for Dynamic Attractions.  This is probably a good idea; the Steel Fab business has not been profitable.

eilpost2

Nelson also gave an update on the SpacePark that was announced when Justin Trudeau visited China in the summer.  I mentioned the agreement in this prior post.  Unfortunately my optimism may have been misplaced.   Nelson was quite candid about the agreement, said that they hesitated with the new release, felt some pressure given that the agreement was attended by Trudeau, and that he felt that the Chinese counterpart only had about a 50/50 chance of securing the needed land for the park.

On August 9th Empire announced a $10 million contract for the design phase of the thirty meter telescope.  On the call they confirmed that this revenue will be seen in 2017.  It’s good to see the telescope, which has been held up by regulatory issues due to its Hawaii location.  Wikipedia describes the backstory well.  I’m not sure that the final location of the telescope has been decided.

The backlog seems to have stabilized after falling from its peak in early 2014.

eilpost3

The improved margins in 2017, the healthy backlog and the additional $10 million contract for the thirty meter telescope design should lead to an improved 2017.

But I want to see how successfully they can transition to this model before I take any more of a position.  Let’s see margins improve, and let’s see orders continue and hopefully increase.

Empire is a typical position.  A decent company, lots of ways to a positive outcome, but nothing has materialized yet.   So it remains a small position as I wait for a catalyst to justify increasing it. 

Swift Energy as a Post-Bankruptcy Recovery Story

Heading into the OPEC meetings I owned small positions in a number of oil and gas stocks.  After the agreement was reached I significantly ramped up those positions.  As I wrote on the weekend, in the days following the OPEC meeting I added back Granite Oil (GXO) and added to Resolute Energy, Journey Energy, and Zargon Oil and Gas.  But my biggest add was to Swift Energy.

I have talked about Swift before here.  I took a position in the spring as the company was coming out of bankruptcy.  They had agreed to a pre-packaged bankruptcy deal that would give existing shareholders 4% of the new company.  In addition to the equity, existing shareholders received warrants.

It was the warrants that caught my attention.  For every share that you received you also received 7.5 warrants.   The warrants were way out of the money ($80 and $86), but they also had a long dated expiry (2019 and 2020).  It seemed like a good leveraged bet on something going right.

Since that time the company has emerged from bankruptcy and the stock has traded up from around $20 to $33.  So that’s pretty good, but remember the distressed levels that many oil and gas companies were trading at in February-March.  Swift has really market performed at best.

I think that’s because the stock has been stuck on the grey markets, and only recently began to trade on the OTC market.  On a third rate exchange and without liquidity, Swift has seen little interest from investors.

Peer Comparison

Below is a comparison I made between Swift and a few other comparable oil companies.  I picked companies that operate in the Eagle Ford and where I could that have a natural gas weighting.  Its difficult to find ideal peers to Swift because most Eagle Ford operators are oily.  Swift is gassy because they found a sweet spot in the gas window in Fasken and have been exploiting it.  But as I will describe, its not wholly accurate to describe Swift as a pure play on gas and they have more in common with their oil peers then their oil weighting suggests.  I know this comparison isn’t perfect: I just took the data directly from the last 10-Q, so it doesn’t account for recent transactions from SM Energy or Sanchez Energy, and all of these companies are bigger than Swift; its difficult to find public oil and gas companies in the Eagle Ford that have an enterprise value on par with them.  I’m open to suggestions.

comparison

Perhaps the closest comparison is Comstock Resources.  Comstock is gas weighted, has Eagle Ford land in the same counties as Swift (McMullen and LaSalle counties) but also has a lot of gassy acreage in the Haynesville.  Comstock trades at twice the valuation of Swift, based on both flowing boe or EBITDA.

I made a comparison based on EBITDA because it was simple, but if anything it understates Swift’s value because coming out of bankruptcy the company has a relatively low debt level.  Swift pays far less in interest than most peers, so more EBITDA drops to cash flow.

Thinking of Swift as a pure gas player is misleading.  The history of the company shows that it has typically had an equal oil/gas weighting.  It has only been in the last couple of years that gas production has dominated.

Fasken Gas Acreage

This shift to gas is because of the Fasken acreage.  In 2014 the company made changes to their completion techniques at Fasken and achieved a dramatic improvement in their results.  Below are well results before and after.

swift1

Swift has focused its drilling on Fasken since it went into bankruptcy in early January.  In early 2015 the gas weighting was around 60%.  In the third quarter it had risen to 81%.

While being gassy is often inferior to having a more oily weighting, the Fasken wells generate strong returns.  Most of the new wells are have produced over 2.5Bcf (over 400,000boe) in the first year:

swift2

At $3 gas the company says that Fasken wells generate over 100% IRR at $3 gas.

Other more Oil Weighted Properties

While the company has focused on Fasken and become a gas-weighted producer as a result, their remaining acreage is more balanced.  In particular in McMullen County (their AWP acreage) they have over 200 locations in their oil and condensate windows:

swift3

In fact, apart from their newly acquired and untested acreage in Oro Grande and Uno Mas, Swift has far more oil acreage than gas.

Much as they “cracked the code” in Fasken and achieved a step change in results, Swift appears to have had a similar breakthrough in AWP.

swift4

The PCQ wells are typically 90% oil while the Northern Bracken/Whitehurst wells are around 50% condensate.  In the south Bracken where it is gassy, Swift has had success not far different from Fasken, with Bracken wells IP30s exceeding 5,000boepd and cumulative production that looks like it will exceed 2BCF in the first year. Below are IP30’s from this area:

swift5

Capital Expenditures

Swift has curtailed their drilling and completion activity since entering into bankruptcy.  In the third quarter 10-Q, they described their 2016 operating activities at Fasken:

At our Fasken field in the Eagle Ford play, eight wells were placed into the system during the first nine months of 2016. Seven wells were placed into the system at rates between 15 – 20 MMcf per day of natural gas and one well had mechanical issues and was placed into the system at a restricted rate of 9 MMcf per day of natural gas. The Company resumed drilling operations at Fasken in October 2016 and expects to drill four wells by the end of the year. These four wells are expected to come online in early 2017.

And in the second quarter 10-Q they described their AWP activities:

The expenditures were primarily devoted to completion activity in our South Texas core region as we completed four wells in our AWP Eagle Ford field and also initiated completion work for four wells in our Fasken field.

Prior to October, the company had not drilled any wells in 2016.  They completed 4 AWP wells in the first quarter, and completed 8 Fasken wells in the second and third quarter.  The impact of these activities can be seen in an area breakout of production results:

swift6

Artesia has seen no drilling activity for the last couple of years and the wells in the area have been declining naturally.  In 2015 the company drilled and completed only one well at AWP and so the decline there is close to natural.  The flattening of production in the first and second quarter at AWP coincides with the 4 well completions during that time.  Fasken saw the majority of activity in 2015, followed by a lull in the first quarter of 2016 and a corresponding drop in production that recovered once the 8 new wells were completed in the second and third quarters.

A few implications can be drawn.  First, two wells per quarter at AWP seem sufficient to maintain production levels there.  Second, 4 wells per quarter at Fasken increased production by 2,000boepd.  Third, production declines at Artesia are moderating and should be fairly insignificant to overall corporate production going forward.

The company has spent $60 million on capital expenditures this year.   In the 10-K the company said they would spend $12 million on corporate and regulatory costs.  That leaves $48 million that has been spent completing 12 wells and starting drilling on maybe one or two of the 4 wells being drilled at Fasken before year end.   Given that completion costs at Fasken are around $3.5 million, tie-in is another $0.2-$0.3 million and that costs are AWP are slightly higher, the numbers line up.

Production Going Forward

At current production rates, $3/mcf gas and $50 oil Swift should be able to generate EBITDA of $130 million and be able to cash flow around $115 million.  That would be enough cash to drill and complete  4 AWP wells and  another 11-12 Fasken wells.  That level of drilling should be enough to grow production, with my guess being by about 10%.

This compares favorably to a number of other E&Ps that I have looked at where I have difficulty seeing how they can maintain production levels at $50 oil while remaining within cash flow. In many of these cases its simply the debt burden and interest payments that bog them down.

Nothing is Perfect

Swift is not without risk.  One risk with Swift is that their remaining drilling inventory at Fasken is modest.   Swift only has about 8,300 acres at Fasken, and in the lower Eagleford, where they have focused their drilling, they only have about 20 locations left.  It remains to be seen whether the upper Eagleford, Almos or Austin Chalk can produce as prolifically.

swift7

I’m also not sure about the upper management.  After emerging from bankruptcy a new Chairman of the Board was appointed, Marcus Rowland.  Rowland was an original member of the Chesapeake team being with the company from the early 90’s until 2011.  I’m sure he had a lot of successes at Chesapeake but he has also been known for steep executive compensation.

A month before Rowland was appointed, a number of Swift’s original executive team left the company, including Terry Swift.  I have mixed feelings about that.  I know that many think these guys were incompetent.  They totally mishandled the balance sheet and then blew it by not hedging anything heading into the 2014 downturn.  But they also were very good operators.  They unlocked Fasken, and showed continual improvement in drilling efficiencies and performance.  I hope that the engineering teams remain intact.

At any rate there is a void that needs to be filled.  They appointed the COO as the new CEO on an interim basis.  But we will have to wait for the longer term plan.

Swift also some lower priced hedges.  They have about 20-25% of their gas production in 2016 hedged at around $2.80 per mcf and another 25% collared between $3-$3.90 per mcf.  They have about 20% of their 2017 oil production hedged at $48 per barrel.

Finally, the Eagleford is not the premier basin that it was a few years ago.  That spot has been taken by the Permian.  As pointed out in this tweet, $50 oil is not bringing back rigs.

//platform.twitter.com/widgets.js
This post, from a blog that provides good information about shale production, illustrates the declining trend the Eagleford has experienced:

eagleford