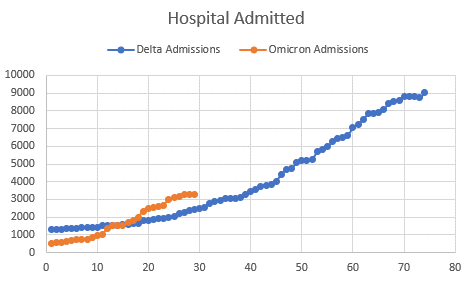
It is starting to look like hospital admissions in Gauteng/Johannesburg are peaking at about 1/3 of what they were with Delta:
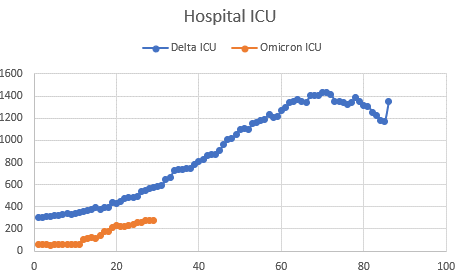
Meanwhile the ICU numbers in Gauteng are still creeping up (because it lags) but they are clearly not going to get to anywhere near where they were with Delta:
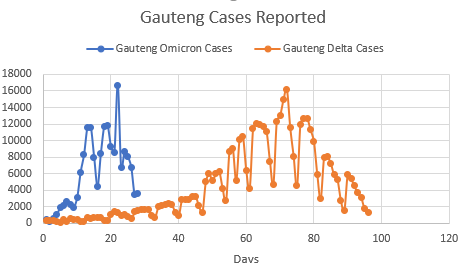
Meanwhile the most important piece of data, cases, continues to plummet. Yesterday Gauteng cases were down 63% week-over-week. Today they dropped 58% week-over-week.
While I can understand that the sudden rise and fall of cases in Gauteng should belay some skepticism (I saw one epidemiologist admit that it is the strangest thing he has seen), I don’t believe you can write-off a week over week drop of 63% or 58%, or the longer term trend that is becoming more clear each day, to mistakes or lack of testing.
The simplest explanation is probably the right one: omicron extremely, extremely contagious and not terribly dangerous and because of that combination it managed to make its way through Johannesburg in about 20 days with the majority of people not even knowing they had it.
Here (in Canada), we are going to test everyone and because of that we are going to see stupid, and I mean STUPID, high cases over the next couple weeks. I bet Alberta blows through its previous case high shortly, with the only mitigating factor maybe being that we gave out rapid tests so some people can test positive at home and not be reported. I plan to tune that out.
But I also think that relatively shortly, the voices pointing out anecdotally that very few are getting really sick are going to get loud. Someone is going to point to outbreaks that we all have read about, like the Calgary Flames, and say 30 guys got it, including coaches, and no one was sick for more than 36 hours? What’s that about? We’re already seeing that in some countries.
The problem is that by the time we have enough data to scientifically prove its mild, we are all already going to know its mild by common sense.
With a more optimistic tilt, it was also hard for me not to notice that parts of the market seem to be bottoming. Biotech for example – all those crummy little biotechs I follow, they are going up and down like crazy in a volatile way but they aren’t really going down any more. At least for the last week. They just kind of test and retest and retest and they don’t really give up the ghost. I bought a few back.
I also bought back bank positions and added a few others. While I can’t say 100% how omicron plays out, I feel reasonably confident that it is not going to be a big enough deal to derail the loan books of banks. So I bought back the banks I sold (like CUBI and BCBP) and some others (like PKBK) I bought anew. I also added BMTX, which I will talk about in a later post.
The market still feels to me like its on tilt overall. And that makes me not want to take too many chances. So I’ll just wade back in here in a few spots that look to be warming up. We’ll see how that goes before I dive in any deeper.
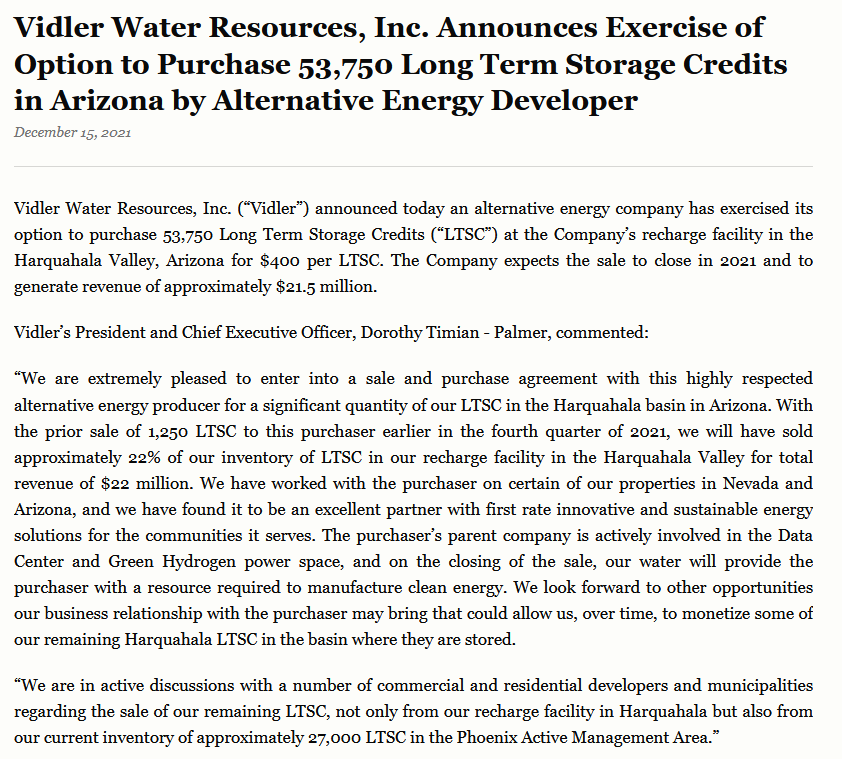
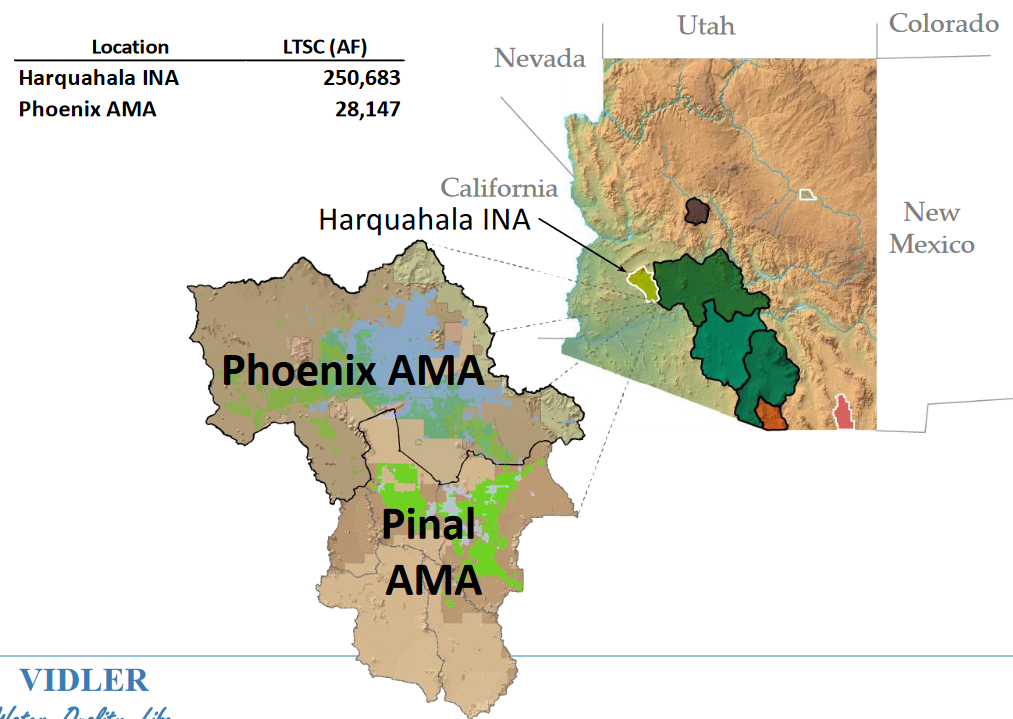
The sale of the Harquahala Valley credits went through last night.
I mentioned that there was a proposed sale a couple months ago. The closing of the sale is a de-risking event. As I said then, the Harquahala credits were probably the weakest link in the whole thesis for me.
Why? Because these credits are outside of the primary metro Phoenix area and because Vidler had never really had a big sale of Harquahala credits so far. So I was not really sure if they were worth what Vidler said they were worth. I also had read about tribal water being sold on the cheap in Arizona (relatively), and so that gave me some doubts as well.
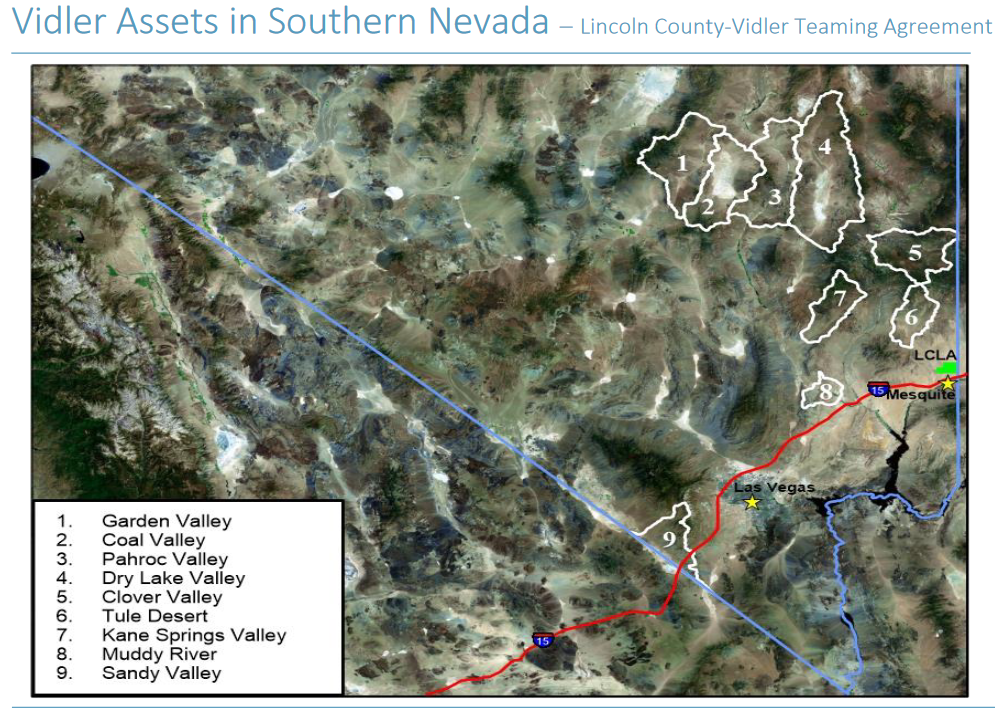
But this sale reassures me. The sale is for a material amount of credits (53,750 LTSCs, or 21% of the total) and the price tag is higher than I had been anticipating back in June (I figured $350/LTSC – this sale went through at $400/LTSC). I believe there is also the opportunity for another sale (the original press release gave a second option, see below), by end of January.
There are other interested parties. In the press release Vidler said “we are in active discussions with a number of commercial and residential developers and municipalities regarding the sale of our remaining LTSC, not only from our recharge facility in Harquahala but also from our current inventory of approximately 27,000 LTSC in the Phoenix Active Management Area.”
I suspect the amount Vidler gets for subsequent credits will be higher than what they got here (you can see that the January option is at $450/LTSC). But even if they got $400/LTSC for all the remaining Harquahala credits that would be $100 million. The Phoenix one’s have to be worth more, so I’d guess that can bring in another $14 million or so there.
If that pans out, it puts the wobbly leg of the thesis at $114 million. Or about half the market cap. Which is not terrible.
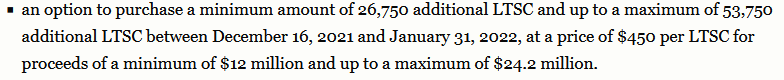
The rumor is that the buyer of these credits is Buffett. Through his owned power producer NV Energy (h/t to @Just_Credo for that rumor). If the rumor is right the parent company they mention in the release, that is “actively involved in the Data Center and Green Hydrogen power space”, would be Berkshire Hathaway’s Energy sub.
NV Energy is building a bunch of solar projects that presumably will need water.
Since 2018, NV Energy has received approval for 12 utility-scale solar projects totaling nearly 2,700 MWs of solar generation and over 1,000 MWs of battery storage which will be in-service by 2024, including the company-owned 150 MW Dry Lake solar photo voltaic project which will be collocated with 100 MWs of integrated battery storage, with the difference procured through power purchase agreements. These projects are in addition to approximately 1,000 MWs of operating solar power for which approval was obtained prior to 2018, of which 15 MW are company-owned
Berkshire just bumped up NV Energy’s capex plans by $1.6 billion.
And what is interesting about that is that the NV stands for Nevada. NV Energy serves Las Vegas and Reno, so where the rest of Vidlers water is.
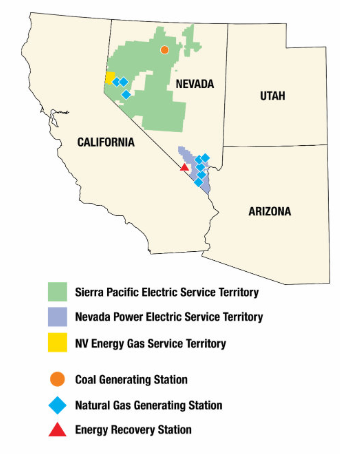
If you take a look at the projects that NV Energy is planning, some line up pretty well with where Vidler has water. The Dry Lake solar project in particular overlaps Vidler’s southern water assets. Vidler said they were in talks with a solar developer wrt their land at Dry Lake at the AGM. Vidler has about 1,000 AF of water rights at Dry Lake in addition to their land position.
And if I really want to go off the grid (in a manner of speaking) I would note that Vidler also has made applications for permits for water from 3 adjacent land packages to Dry Lake: Coal Valley, Garden Valley and Pahroc Valley.
Quite honestly, trying to figure out what is going on with these areas has made my head spin. I had basically ignored them in the past. But this NV Energy angle makes it interesting. There are some tidbits, like this filing on Coal Valley, that suggests there is a lot of water here:
Likewise you can dig around for Pahroc Valley and get some hints there is quite a bit of water there as well.
Now will any of this water be granted to Vidler? That is a whole other question and it still makes these assets pretty much impossible to put a $ value on other than $0. Note that the filing I snipped the Coal Valley paragraph from was a written opposition to a motion to designate that land, which, if granted, I think would limit the water that can be removed, maybe by quite a bit. So if that went through it would limit what Vidler could extract. Overall it’s not at all clear when and if this water will be available to Vidler.
But having disclaimed all that, what has changed with this new relationship with NV Energy is that suddenly I can see a buyer of this water if Vidler can get some of it approved. That in itself is interesting. Especially since I basically mark these assets at $0 right now.
So that’s the southern assets. The last piece of the puzzle is the Fish Springs water up by Reno. And here we had a pretty interesting development too.
The Truckee Meadows Water Authority had their board meeting December 7th (another h/t to @Just_Credo for pointing me to the meeting). You can listen to it here. Around the 25 minute mark they start talking about the American Flat Project, which is a demonstration project for reclaiming sewage water.
Vidler comes up and it’s interesting how it comes up. The board is pretty adamant they don’t want to compete with Vidler, and that they want to make sure this project does not interfere with the Fish Springs water that Vidler is waiting to provide to Reno/Sparks for new developments. There is talk about how the project managers of American Flats are already in discussions with Vidler about how this water would be used.
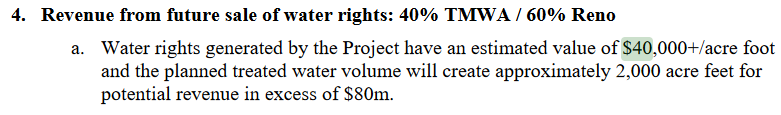
But most importantly, in the minutes it shows the assumptions used for the project; that they are using at least a $40k per AF number for what that water is worth:
This is essentially another de-risking event. We know that Vidler has been saying their Fish Springs water is worth $40k per AF give or take. But is it really? Well, now we can say with more certainty that yeah, it probably is.
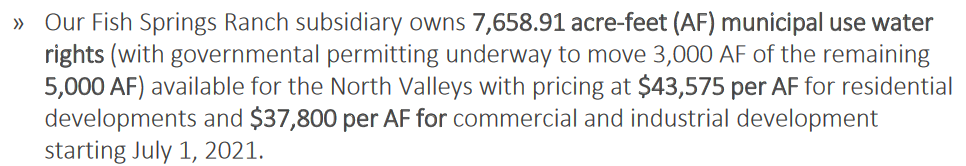
Remember, Vidler owns 7,658 AF of approved water rights and the potential for another 3,000-5,000 more.
At $40k the approved water alone is worth $300 million+. (note: I should be clear on this – Fish Springs is a 51/49 partnership between them and the TMWA. But Vidler gets cost recovery first, which currently is $205 million and accruing at ~4.75% per year. So if it was sold today at $300 million, Vidler would get $256 million of that. More likely though this water is sold over a number of years as land is developed so the accruals will increase Vidler’s chunk. Next year the first $213 million accrues to Vidler, the year after that the first $224 million, and so on… in fact, I think you could argue that if Vidler can continue monetize all its Arizona LTSCs over the next couple years, using the proceeds to buy stock, it would be in shareholder interests to hold Fish Springs and let it continue to accrue to Vidler).
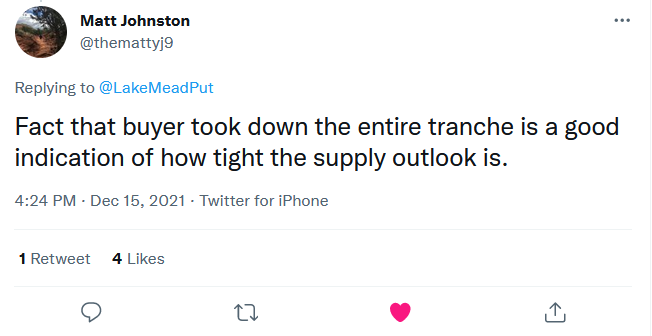
One last interesting point here. Last night when the news was announced, the twitter account @lakemeadput tweeted it out. This guy responded:
Who is Matt Johnston? He is a portfolio manager for Social Capital, Chamath Palihapitiya’s company. I can’t remember if I mentioned it before but the blog ESG Hound did a whole post on Chamath’s comments on water on his All-In podcast.
All kinds of dots connecting here.
You put all these pieces together and this story is de-risked from when I first mentioned it in June. Yet the stock price is about the same.
At some point I think that has to start changing. This $22 million that will be coming from the announced deal yesterday will help. We know a big chunk of it will go into buybacks of the stock. That will hopefully be a start.
Question is how many asymptomatic. If a week ago I had been given a list of 20 things that could happen with omicron in the next week and I could pick 19 of them, the one I wouldn't have picked would have been cases start dropping in gauteng
This week has been a roller coaster of data for me. I entered the week concerned about Omicron. I needed more data and I knew the week would be important for that.
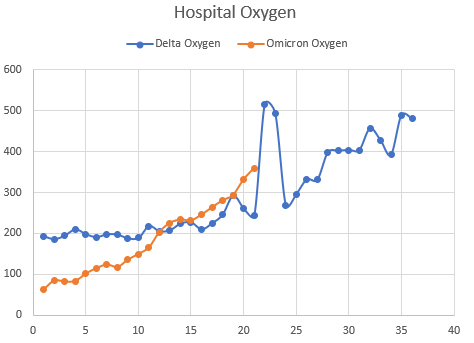
The first few days of data this week didn’t look great. What was concerning to me came from the hospitalization side. When I looked at those admitted to hospital and the oxygenated patients, the trends were above where Delta was at the same time period in the wave:
That was concerning.
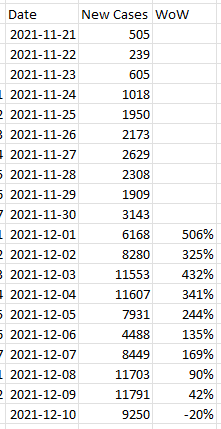
But… then something else happened. Beginning on Wednesday, the week-over-week increase in new cases in Gauteng began to decelerate. It had actually been decelerating for a couple days before that, but I figured you could chalk that up to weekend data and the very low base we were starting at.
But on Wednesday the new case number for Gauteng came in surprisingly low. It was 11,703, which, while up 90% week over week, was no higher than the highs the previous week.
Hmmm – my first thought was this must be testing limitations. And sure enough, if you went back to the Delta wave you could find articles saying that at the peak (when cases were in the 11k to 15k range), getting enough test kits became a problem, lines became a problem, waiting 5 days for your results.
So my working thesis on Wednesday was let’s hope its slowing but I don’t trust those numbers.
I carried that into Thursday, when the new case number for Gauteng came in at 11,791. Same kind of ceiling, so maybe it is the test limitations right?
But then Friday’s number came out. 9,250. That was down 20% week over week! And positivity declined, at least for the country as a whole, from 29.5% the previous day to 21%.
While I can only go on a few data points, there is no two ways around it, these numbers imply that cases are peaking, which means this Omicron is not going to amount to much.
How does this variant pop out of nowhere, cases go straight up for 2 weeks at a rate that dwarfs Delta, and then that’s it? And this is in Johannesburg, a city of 12 million people, so its not like it ran out of people to infect.
Good question.
There is only one way I can make sense of it. The scenario that would create this sort of huge spike and fast peak is if the variant was not just mild, but incredibly mild. Maybe 9 out of 10 people that got it felt nothing, or even 19 out of 20. That, plus being incredibly contagious, could allow it to circulate extremely quickly, infect like a million or two million people in Gauteng in a few weeks, with the vast majority never knowing they had it.
Only a few 10s of thousands of people actually go to get tested, some for completely non-related reasons. A bunch of them have it, which gives a massive rise in cases and a subsequent, very quick, fall.
If that is the case, then the rising hospital numbers are really not that concerning. They will peak shortly as well. And Omicron will indeed be a nothing-burger.
So what am I going to do about it – investing wise? I don’t think I’m going to do much.
Here’s the thing. When I go through all the stocks that I have sold over the last 3-4 weeks, nearly all of them are actually lower then when I sold them.
Stelco – lower. Algoma – lower. Westlake – lower. Olin – flat. Every biotech name – lower. Every oil name – lower. Every gold name – lower. Banks – some lower, like BMTX, some flattish. SaaS names I thought were oversold (LivePerson, PagerDuty, Telos) – flat to lower.
Remember, when I started selling (as I wrote here) it had nothing to do with Omicron. It was just that things weren’t working. Stuff was going down when it felt like it shouldn’t. Stocks felt heavy.
But how can I say that stocks feel heavy? The S&P is at an all-time high. It just rallied another percent on Friday.
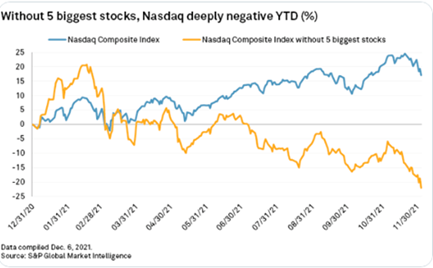
Well, I think the following chart sums that up quite well. This is Nasdaq with and without Microsoft, Nvidia, Apple Tesla, Amazon.
It’s a bear market folks. Unless you own those 5 names. In fact, if you look at it from the top instead of the beginning of the year, it is a complete disaster – the Nasdaq-ex-these-names is down almost 40%!!!
No wonder I have felt like I have been battling up hill since the summer. Quite honestly, if it wasn’t for Aehr, a couple biotechs that I fluked out with, and some sharp trading (sell the pops and buy the dips even if you like the name for the long-term) I’d be in much worse shape.
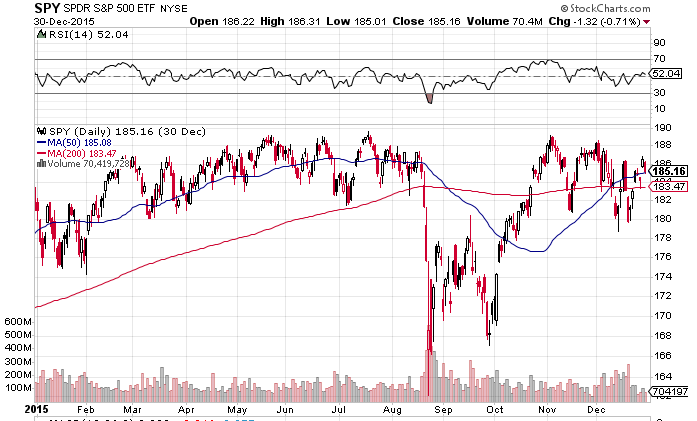
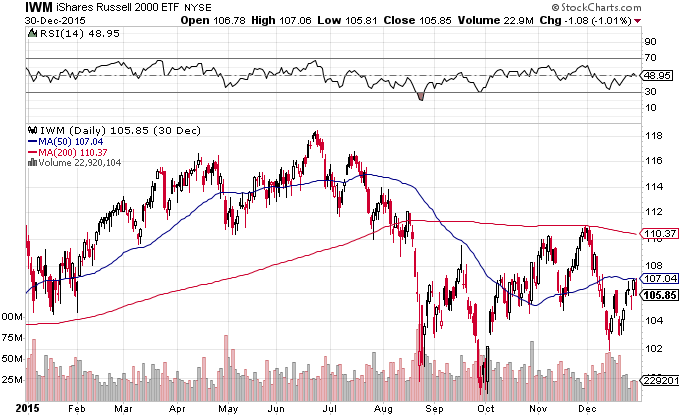
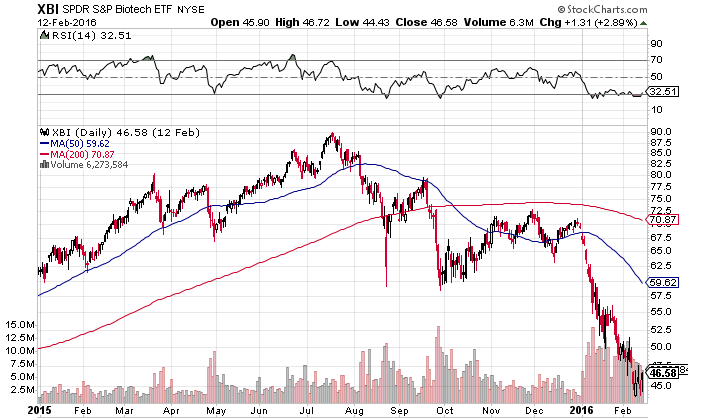
This all feels very much like the second half of 2015 to me. The chart of that time, which I reproduced below, maybe does not look like a great comparison on the surface, but the spirit of it is.
The comparison starts in May or June 2015, when the market was trucking along at its highs, but I was feeling like the stocks I owned and followed were not really doing very well. They felt heavy.
One difference between then and now is that the market sold off big in August 2015 because people got worried China was imploding. You can read about it on wiki. Obviously we haven’t had anything quite like that this year.
(Note: Oh, and btw the Fed had just ended its quantitative easing in October 2014, which is not too different than now, where we are beginning to stop as we speak)
But the real comparison for me is that time after the China panic. I remember how the market rallied from September through to the end of that year and I remember thinking at the time, how is the market going up, because the stocks I watch sure aren’t? My portfolio did not do great, I was down about 6% even as the market matched its highs.
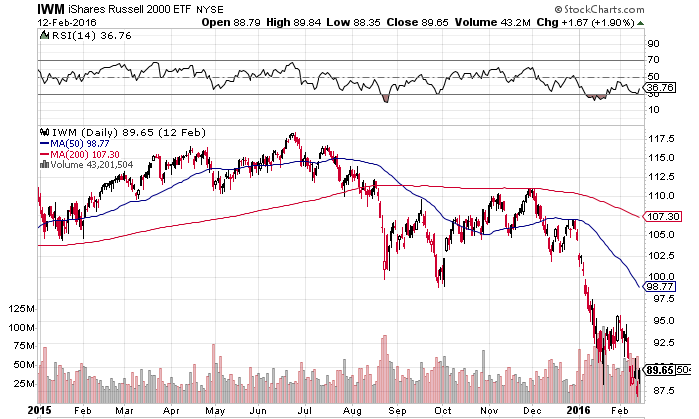
You can see the performance gap I’m talking about in the small-cap index, the Russell. The Russell did not go back to new highs.
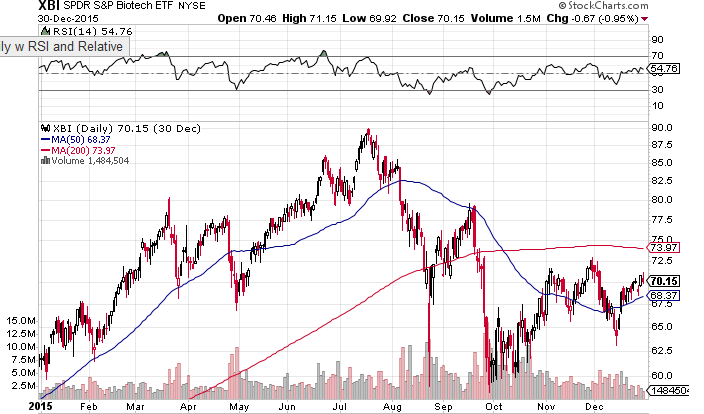
Even less surprisingly, the XBI just kept going down.
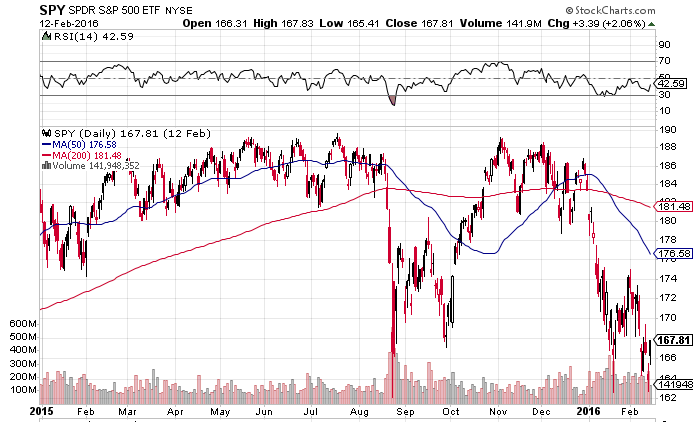
Now… I made a point of creating all these charts to year-end 2015. Guess what happened January 2nd? The market as a whole finally gave up the ghost:
And when it did, small-caps, biotechs and all that speculative stuff I tend to own really went south.
I will never forget that first week in January. While it does not hold the memory of investors like the big financial crashes, it holds a memory for me. I could not believe the speed with which my portfolio went down. I think I lost close to 10% in like 5 days. And I thought, at the time, that I was reasonably protected. It is not like I had one big position that got creamed. Everything did.
I was in a state of shock. It was at this point that I started looking into hedges and shorting, because I was like, this is crazy, I can’t let myself lose this much money this fast.
But back to my analogy of today. The comparison I want to highlight is that small caps, biotech, actually a lot of things are very weak right now, even though the market is at all-time highs. And I feel like that bodes poorly. The big index is often the last soldier to fall. But that doesn’t mean that the other stocks, which have been falling for months, will relent. Like this 2015-2016 analogy, they can just fall some more.
Or just to make it simpler, to repeat what I said back in November: Things aren’t working. Best not to force it. I’m going to cautiously say that my concern about Omicron appears unwarranted. But I’m not going back in the pool just yet.
There is this hospital report out of Gauteng that has the media writing headlines left and right about how Omicron is mild.
I wrote in the comments of my last blog why I think that the data provided by that hospital isn’t saying what everyone is saying it is saying. I don’t think it is tell us much in fact.
But what is the actual data saying?
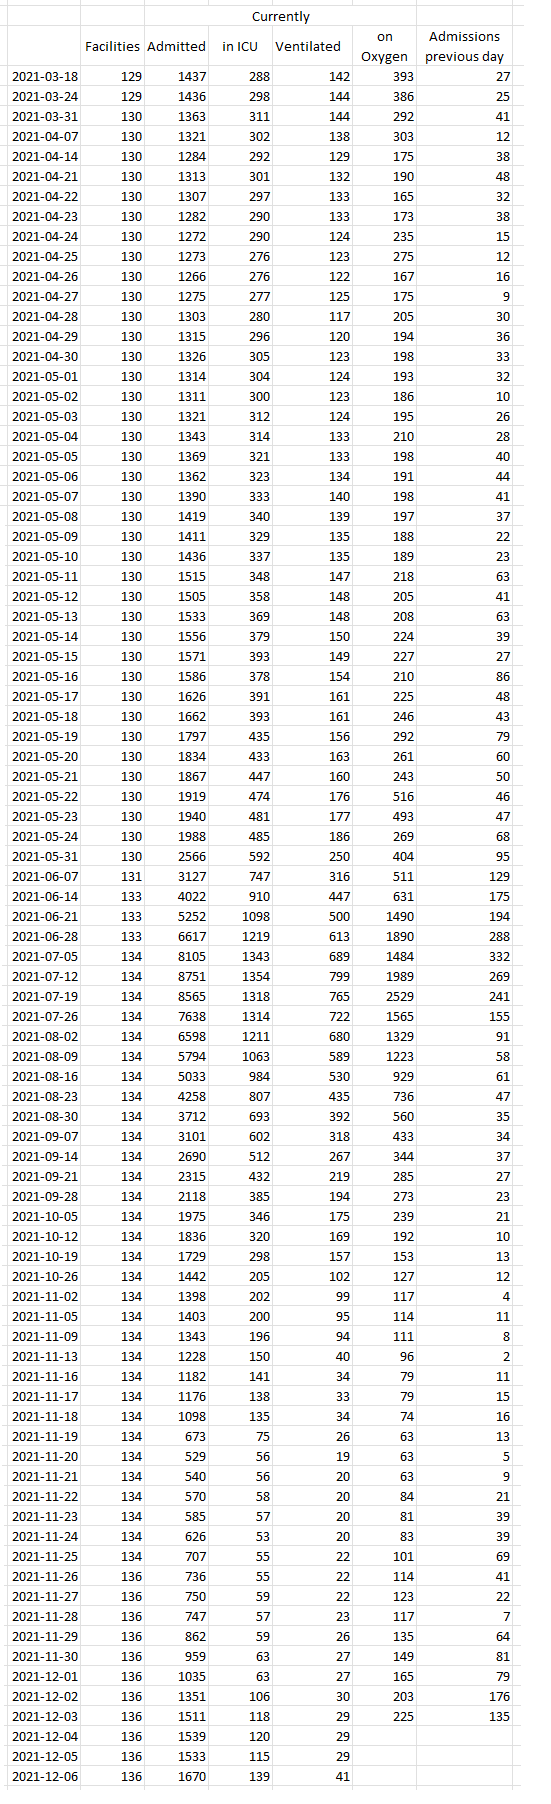
Below I have tabulated the data from Gauteng. Guateng is considered the epicenter. It should be where we see indications of severity first.
The data is in PDF on their website so it is a pain to put into excel tables.
Now there are a couple issues with this data.
First, something happened on November 19th – one of the hospital groups (Netcare) changed their reporting practices or something, because all the numbers for that hospital group dropped by like 50% overnight. There is a similar drop that mostly impacted ICU and Ventilated patients from Nov 10-11, all due to a change at the hospital group Lenmed. These sudden changes, all downward, make comparing apples to apples before and after November not possible. But you can still see trends.
(Note: there was actually a 3rd change on October 21st where Clinix hospital group numbers dropped suddenly)
And then to make it even more difficult, since December 3rd the National Institute for Communicable Diseases (NICD) stopped putting out full daily data surveillance report. So I had to cobble together what I can for the 4th – 6th.
Finally, the data is messy. It clearly isn’t always correctly reported. Take a look at May 21-24. The number of oxygenated people jumps around like a yo-yo. But those are the reported numbers.
This is the data from the most relevant periods. To make it so it isn’t a 5 page long table, the table just shows the daily for the two most relevant periods (the first few weeks of Delta, when hospitalizations began to rise on about May 3rd until May 24th, and the first few weeks of Omicron, which seemed to have began somewhere around the 23-24.
I’ll comment on this some time later. I don’t really understand what is going on here tbh. Everyone, including Fauci, is saying that the early indications are that this is mild. Is that what this data looks like? It actually makes me feel a little sick. But I’d love a more positive perspective on it.