March Update
My troubled feeling about the market began on January 8th. And not necessarily to the downside.
I was worried in the sense of “I’m not comfortable with what is going on”. I was actually worried as much about a melt-up as a melt-down. I wrote:
I have become actively worried about my hedges. So much so that before the market closed Thursday I went through all my inverse index positions and calculated how much my portfolio would lose from them if the market was up 2%, 3% or 4% on Friday. And then I adjusted their size to make sure each was at a level I could live with.
This is not normal.
I remain uneasy. About index hedges, about many longs.
In response, through March I got smaller. Both on the long side and the short side. Slowly reducing my hedges. Reducing my individual longs.
This week I took the step of being completely out of S&P and Russell inverse ETFs. I am unhedged!
Yet I am not bullish. I added more cash and I reduced a lot of the micro-caps I own.
We have had a crazy period of small cap out-performance. As I wrote in my last post, I thought that many corners of micro-cap land had gone too far.
So I am changing tact. Selling the small stocks and looking to own big ones.
The S&P index continues to do great. If you simply looked at the chart of the S&P, you would conclude I should be very bullish.

That chart is saying that nothing untoward is going on. The market is clearly going up. One look at this chart and you would conclude that you certainly do not want to be short right now.
BUT…. under the hood it is far more chaotic – and much less certain.
This is the problem – for me at least. The market is going up but the same can’t be said for many names. You can get creamed in this market if you own the wrong stock.
Leading the charge of this malaise are the stocks that led the market up for the last year. The following two charts are what I would call “type curves” for a wide swath of tech/SaaS, clean energy and biotech high-flyers.
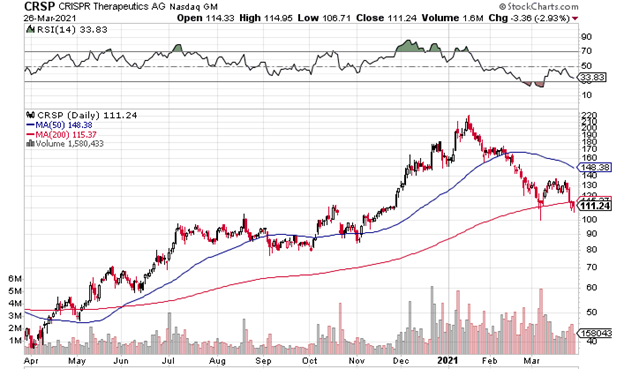

“Type curve” is oil and gas parlance for an expected decline curve from a well. In a given reservoir you might have 2-3 type curves of potential well performance. When you drill a well you expect that it will perform roughly along one of those curves, and a bunch of wells should average out to the type curve.
In this case, our type curves are two charts that fit the form of many, many stocks.
First, the CRSP chart fits all the stocks that ran up huge from the day of the November election until mid-January to mid-February (many, clean energy stocks, biotechs, and lots of micro-caps,).
Second, the TWLO chart fits the SaaS and stay-at-home world. These are stocks that saw a relentless march up from the March lows of last year until mid-January to mid-February.
For those of you that do not follow individual stocks particularly closely, I recommend going to stockcharts.com and looking up the one-year charts of the following symbols: SE, ROKU, TWLO, PINS, PTON, ETSY, SQ, CRWD, TDOC, NET, TTD, TSLA, Z, PSNL, XONE, SSYS, DDD, FTCH, DDOG, FSLY, ZM, OKTA, TEAM, NLS, ADBE, SHOP, ZS, LSPD, PLTR, HUBS, CDLX, DOCU, IDN, PD, PAYC, CRM, LPSN, EXAS, BNGO, CRSP, PACB, TDOC, NVTA, TXG, CLPT, NSTG. I could go on.
Tell me these aren’t all the same as one of the above two charts. The numbers are different, there are nuances, but the type curve, ie. the basic pattern, is the same.
This is just a small sampling – the SaaS names and a few biotechs I follow. If I listed all the electric vehicle names and clean energy names, like a QS or a FUV, or if I listed all the really crappy micro-caps (like IPWR, OEG, etc) you would see higher peaks and more distinct, severe sell-offs. But they would all have the same pattern. The point being that there are so many stocks that fit these type curves right now.
If you spend some time going through all of these charts (and the other 100 or so that I look at each week), it is hard to want to be really long right now.
These charts all look like they topped out a month or so ago, broke down from that high, and now are about to do one of two things. Either consolidate at lower but lofty levels, or make their way down another leg.
Is it the former or the latter? I mean, who knows.
But I lean toward the latter. To reiterate what I said in my last post, there are a lot of names that don’t make sense to me. To add to that list, I find it hard to believe that TSLA (to use the most obvious and biggest example) can consolidate at $625, or a $600 billion market cap. That is 12x bigger than Ford, 10x bigger than GM and 6x bigger than Volkswagen. Meanwhile its business is seeing competition from all sides, its sales growth slows and its founder appears to be finally getting a microscope to his actions.
Or take PLUG, which even after being cut in half in the last 6 weeks has a market cap of nearly $20 billion. That is a little less than half the enterprise value of Renault, the French automaker that is partnering with PLUG on a new H2 commercial vehicle. Renault has $50 billion of revenue and $5 billion of EBITDA. PLUG has never had $250 million of revenue or even $10 million of EBITDA. PLUG actually had negative revenue last (yes, that’s right, negative) and they are restating their financial statements because they found accounting errors.
But what do I know? Maybe TSLA IS consolidating at $600 only to make that run to the $3,000 price target that ARK Investments put out for it on Monday this week. Maybe PLUG IS on its way to being a $100 billion leader of the hydrogen economy. When things have gone bat-shit crazy there is very little point trying to rationalize what the future outcome may be.
So what am I doing? Well I am certainly scared to be short and kinda scared to be long. That does not leave much left.
To a large degree, I am just sitting this out until it is a bit clearer. I had a good year last year and a good first month and a bit this year and now my main goal is to not blow it.
I don’t like micro-caps in this market for a number of reasons. First, they had a huge run since November. Second, the IWM (the micro-cap index) has the same chart as type curve #1. Third, the IWM is full of names like PLUG and PENN that are high-flyers and could roll over big-time if things go south.
But I don’t own those stocks so what do I care? The problem is that micro-caps are very susceptible to catching a cold. If the bigger one’s roll over the smaller one’s will get creamed, even if their fundamentals are far better.
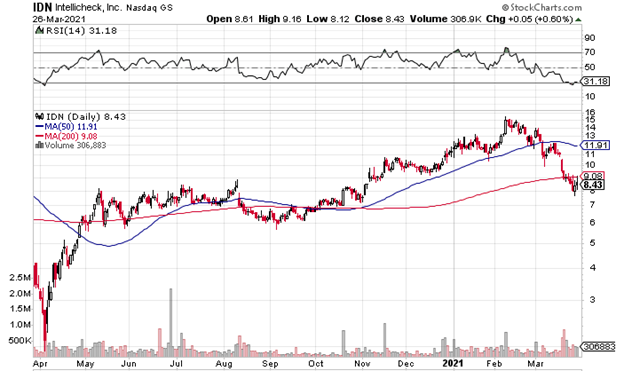
You have to consider which stocks might get caught up in the unwind. A stock like Intellicheck should be a reopening play, but it is clearly in a downtrend of SaaS and high-flyers and who am I to say that $9 or now $8 is the bottom and not $7 or $6 or $5. Its basically the same chart as all those stocks I mentioned above.
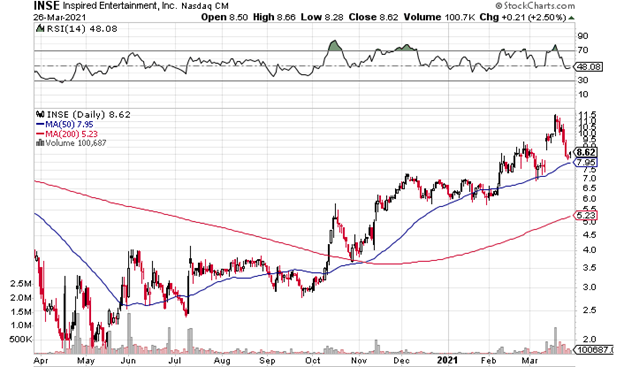
And adding new positions in micro-cap land is equally tricky right now. Take Inspired Entertainment – INSE, a stock I talked about in October (at $3!!). I owned INSE from $3 to $5.50 or so. I sold it because when a stock nearly doubles in a couple of months, in any normal market it would make sense to take profits. In this market, I instead watched it go to the moon after I sold. But if I had panicked (to the upside) and bought the breakout in early March, thinking OMG, FOMO – it’s another leg up (!!!), I would have been creamed this week and last.
That is to say, these are more dangerous times than they appear. Even though the S&P looks like a smooth train up, there is a lot going on with individual names that raises an eyebrow. And if you are caught too long (or short for that matter) in the wrong individual name you could get hit pretty hard. And micro-caps are minefields at the best of times.
On the other hand, I know there are trillions of stimulus checks and I have read or seen so many articles about the Treasury General Account and how there is $4 trillion in it that is coming out and is going to flood everything with liquidity the next few months. And of course there is vaccines and reopening and blah, blah, blah. So maybe the indexes keep going higher.
Last post I talked about Facebook and Amazon. Google is another that has been consolidating for 2 months and does not seem to be particularly expensive for a well-moated tech firm with 20% growth (it trades at 25x 2022 earnings). Abbvie trades at under 10x earnings and really has not done much of anything. Likewise for Bristol Myers, which trades at 8.5x this years earnings. Walgreens is 10x 2022 EPS and is one of the few stocks that has yet to get to its pre-Covid levels. Even IBM is kinda interesting – 12x EPS and yes I know it is hated but wasn’t Intel hated not long ago?
I am still long many of the regional banks, though with much reduced sizes. I am out of many of my microcap positions. My cash levels are high. I did go long a few gold stocks again, mostly because some of them had become so bombed out a couple weeks ago that they just seemed too cheap (Fiore Gold was down to 3-4x FCF at its low and New Gold is still at ~6x 2022 EPS at far lower copper prices).
Most importantly, I have almost no index shorts. The only one that remains is a small position on the Nasdaq (PSQ), which I’m keeping on to balance against the mega-cap tech positions. But I do not trust these index shorts right now. Take that move Friday afternoon. That was crazy.
The shorts I have are mostly long-dated out-of-the-money puts on the highest of flyers. These are smallish bets that have big payouts if I am right and names like TSLA, PLUG, PTON, XONE and the like are not just consolidating and do indeed breakdown.
I started putting these puts on in January, so some are much closer to their strike prices then they were then. They only amount to ~1.5% of my portfolio. If they all go bad then it’s a manageable loss.
Unlike shorts, with puts I can only lose what I invested. In that January 8th post I explained how nervous I was with TSLA, that it might gamma-squeeze further and that my short position might blow up one morning. It may have been irrational but the fear was real. So I exchanged my shorts for long-dated puts.
These and other puts I bought are now in the money. If a few of these high-flyers continue to crumble, they could be worth gains of five or ten times. I still need more weakness to get those kinds of gains so it may not happen. I need TSLA below $400 or PLUG below $20. But we’ll see.
These next few weeks will be interesting. We’ve have two tests of the support levels. You can see that with the TWLO and CRSP charts. Another rally maybe? And then if that one fails, things won’t look very rosy for the type curve stocks.


Nice article.
I look at it as I have 2 choices now: 1. Sell stuff I like, get smaller and likely the broad markets come down with these overvalued stocks leading the way and then buy, or 2. Hold onto the cheap stocks that I own and ignore the market fluctuations and hope the value of these stocks outweighs any market issues.
So far, I am going with approach #2 (with a cash position that is moderately higher than normal), but every day I think about whether this is the right approach.
It is definitely one of the most tricky markets we’ve had in a while.
That sums it up well. Its such a bizarre situation. The popping of a stock bubble at the same time as a the beginning of an economic cycle. I just don’t know what to do with that?
Are you watching those ARK funds? There has to be a good trading opportunity there at some point? She is now selling the more liquid names to buy the more illiquid ones.
Not really. Those stocks are super volatile. I have some puts on XONE but I didn’t actually realize that was a part of ARK at the time I bought them.
Great update
I shorted ARKK middle of Feb and mitigated a lot of losses that would have otherwise incurred to my SaaS basket long (from last year). I think truly from a rate of change perspective, these WFH stocks have topped in the foreseeable future. Hard to beat last year’s earnings on rate of change basis and the multiple expansions that occured when 10y fell to 0.6%. I do think some of the SaaS names are still worth holding onto, but I have no interest in allocating more money into that basket for now.
Have you checked out some of the semiconductor capex plays? I feel like they are very similar to your big cap thesis. A few of the names have ran pretty far already but their valuation is not in outrageous territory yet – ASML, AMAT, LRCX, KLAC
Which are the SaaS names you are continuing to own?
TWLO, DDOG, TTD, PINS, JMIA, and FTCH right now