This is the Data
There is this hospital report out of Gauteng that has the media writing headlines left and right about how Omicron is mild.
I wrote in the comments of my last blog why I think that the data provided by that hospital isn’t saying what everyone is saying it is saying. I don’t think it is tell us much in fact.
But what is the actual data saying?
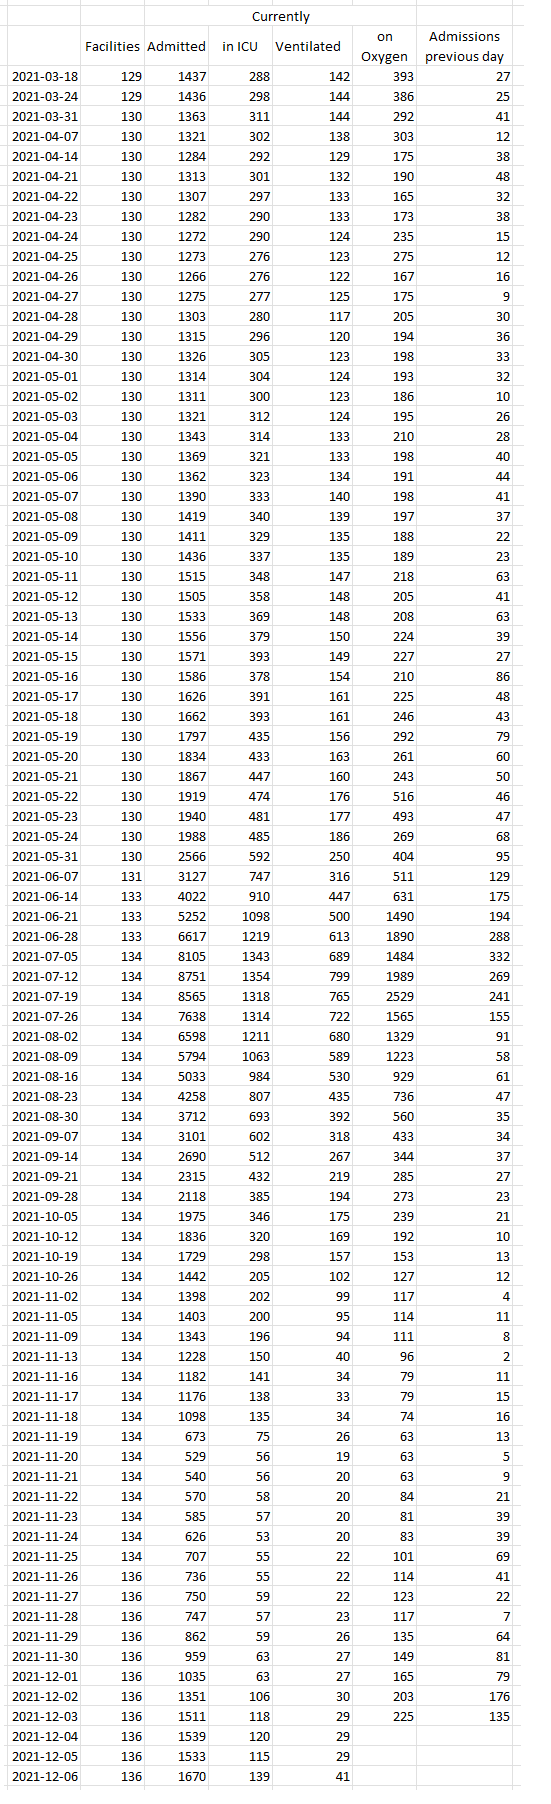
Below I have tabulated the data from Gauteng. Guateng is considered the epicenter. It should be where we see indications of severity first.
The data is in PDF on their website so it is a pain to put into excel tables.
Now there are a couple issues with this data.
First, something happened on November 19th – one of the hospital groups (Netcare) changed their reporting practices or something, because all the numbers for that hospital group dropped by like 50% overnight. There is a similar drop that mostly impacted ICU and Ventilated patients from Nov 10-11, all due to a change at the hospital group Lenmed. These sudden changes, all downward, make comparing apples to apples before and after November not possible. But you can still see trends.
(Note: there was actually a 3rd change on October 21st where Clinix hospital group numbers dropped suddenly)
And then to make it even more difficult, since December 3rd the National Institute for Communicable Diseases (NICD) stopped putting out full daily data surveillance report. So I had to cobble together what I can for the 4th – 6th.
Finally, the data is messy. It clearly isn’t always correctly reported. Take a look at May 21-24. The number of oxygenated people jumps around like a yo-yo. But those are the reported numbers.
This is the data from the most relevant periods. To make it so it isn’t a 5 page long table, the table just shows the daily for the two most relevant periods (the first few weeks of Delta, when hospitalizations began to rise on about May 3rd until May 24th, and the first few weeks of Omicron, which seemed to have began somewhere around the 23-24.
I’ll comment on this some time later. I don’t really understand what is going on here tbh. Everyone, including Fauci, is saying that the early indications are that this is mild. Is that what this data looks like? It actually makes me feel a little sick. But I’d love a more positive perspective on it.


I bought some way out of the money S&P Jan puts today. This is the rare occasion where options are not reflecting the event. Either this thing is a nothing-burger and I lose the value of my puts or this this is what I am afraid of and puts of the S&P could do extremely well. This is the best insurance I can see. I know my loss. And my gain is very large if the right event plays out.
Arent airline puts better? Especially AAL seems expensive. Given the much higher sharecount they are at 2019 levels already.
Thanks you are right. I haven’t been thinking much about positioning so I just looked at S&P puts and thought, this seems like decent insurance. I’ve been consumed looking at the data. Especially after the rally this morning, the airlines might be worth a gamble.
The overnight data dump from gauteng looked bad again, even though the market seems to be ignoring it.
Have also considered buying puts on something like USO or UCO or just buying SCO.
What specifically do you mean with “The overnight data dump from gauteng looked bad again”?
I have a hard time even accessing the website for some reason.
https://twitter.com/Keubiko/status/1468239304585588737
I should not have said bad. It is really all in the eye of the beholder. I have my opinion but I’m sure someone else can look at this and say its positive.
Got it, thanks for clarifying. I guess what I do find very encouraging is the qualitative evidence from the hospitals.
FWIW here is what a friend wrote who’s wife is a nurse:
“Yeah, I’m more interested in the qualitative comments vs the data, in this case. Because, as he noted, the data and how it is calculated often changes. And look at what happened in these first two years of the pandemic. All sorts of arguments about data. But what is not fudged is the stories and pictures you see/hear from front-line healthcare workers. It’s a fucking war zone right now in our local hospitals in the ICU/ER because of Delta. It was that way around this time last year from the first round to really hit us hard. People were arguing about the data and what it means and if you died from Covid or with Covid, etc. But the hospital situation doesn’t lie. If you walk around the hospital and people are not oxygen dependent, and they are there for other reasons and then find out they have Covid, who gives a fuck if they changed the way they report something. I’ve been looking at qualitative factors for a long time, and it’s been an accurate barometer. I think you also mentioned something similar over the weekend.”
Is this is from a nurse in Guateng?
No, they are in the US.
Ok, thanks
Another friend of mine has contacts in South Africa and is reaching out to them right now.
I think that for a current snapshot it is important where in SA. Northern areas are far ahead of south. If you look at Cape Town, they have not seen any increase in hospitalizations yet. I mean, a roughly week ago (~8 days) there was no increase in guanteng, which is the “epicenter”. This is all moving very fast imo.
Well I bought some AAL puts, will probably slowly expire worthless, like all the other options I bought lol.
Tobacco is also a nice thing to hold here. They all look quite cheap, with BTI probably the most interesting of the bunch. They just announced buybacks and only trading at about 7.5x 2022 earnings.
Good timing. It has gone strangely red here in the last few minutes. Odd…
This is an anecdote from Johannesburg https://www.nzherald.co.nz/world/covid-19-omicron-outbreak-children-hospitalised-with-moderate-to-severe-symptoms/QCNS4VJU3H2WEN3UOJU5PEZXYM/
So maybe some good news. Case rise is decelerating quite a bit week over week in Gauteng. But… I have to say “maybe” good news because the positivity rate in Gauteng is >35% (!!) and some parts of Gauteng are apparently 60%+, which is crazy (it briefly got to 25% in Northern Alberta when things there got very bad) so I’m just not sure how much I can trust that number since I suspect they have hit their limit in testing capacity.
I do note that they’ve never had cases much higher than this in any wave. And, when cases did hit this level during the peak of Delta there were news articles talking about how they were running out of test kits, lines that were hours long, and a 5 day wait for results.
So I’m not jumping back in the pool… but anyway, its maybe some good news especially if it holds and actually starts dropping.
ICU admins jumped 31 in the last day from 179 to 210 which isn’t super. The number is still low overall (you can compare it to the time period before Delta hit, when ICUs were 300, but that also makes it so you can’t compare apples to apples on the absolute numbers since Delta started at 300 whereas Omicron started at 55).
But I do think its valid to compare ICU admissions since hospitalization admittances started to rise due to Omicron to when they started to rise with Delta. With Omicron we have had 154 admissions to ICU since what I would call (conservatively) Day 1 for hospitalizations (Nov 21). That is 19 days. With Delta, it took 22 days to get to add 150+ admissions to ICU (I am assuming that this was all due to Delta, which it probably wasn’t, but again being conservative in favor of the mild narrative).
So that’s interesting. Because obviously cases testing positive have been much higher this time around, so on that alone you would lean toward Omicron being less virulent. There must be more people out there with Omicron COVID then there were with Delta COVID at the same snapshot in the spread, but ICU is filling up similarly. Conclusion would be that Omicron is less dangerous.
But… again, every time I start to lean that way, I am pulled back by the “but its going so fast can you trust the data” question? The problem is, of those positive cases, the majority of them have been in the last 7 days (70% of cases testing positive have been in the last 7 days, 80% in last 8 days) while with Delta the case pick up was more gradual and it started at a higher level because regular COVID was still prevalent. So again, apples to apples with the ICU number is very tricky. But what I think you can say is that you should be able to conclude a lot more in another week, these next 5-7 days will be key, because a lot more existing cases will get into that 2nd and 3rd week where if they were going to ICU they would be doing so.
Cases in Gauteng actually went down today! I have no idea what is going on. How does this variant pop out of nowhere, cases go straight up for 2 weeks at a rate that dwarfs Delta, and then that’s it? And this is in Johannesburg, a city of 12 million people, so its not like it ran out of people to infect.
Quite honestly, it doesn’t make much sense. But the numbers are what they are. So maybe this is it? Hospitalizations and ICU are still going up but that doesn’t really matter if the virus really burnt itself out in 2-3 weeks.
Maybe its been circulating longer (though the wastewater data doesn’t really show that)? Or maybe it is just incredibly mild and incredibly contagious and it infected like a million people in 3 weeks but only a few thousand actually went to get tested? Or is the data just bad? Its so weird but it is what it is, at least right now.