Skip to content

Posts from the ‘Aurizon Mines (ARZ)’ Category

Letter 23: Thinking it Through

Let’s Start with Europe (again)

The unfortunate reality of investing at the moment is that you cannot make a decision without first appraising the situation in Europe.  Correlations of most stocks, most asset classes, have gone to one.  The ability of the ECB to buy Italian debt, or the liquidity position of Societe Generale weighs as much on the price of Coastal Energy or Arcan Resources as does the success of their next well.

Its a bizarre new world.

This week Europe had their latest summit installment.  The response of the market to what transpired was confusing.  The market crashed mightily on Thursday, only to rally just as mightily on Friday.  Italian and Spanish bond yields spiked on Thursday but then dropped modestly on Friday.

Given the confusing signal sent by the market, I want to take a few minutes to step through what was agreed to at the ECB and among the EU members.  Hopefully we will be able to draw some useful conclusions as to what it means to the stocks we invest in.

The Fiddling of the ECB

A tweak here, a tweak there and pretty soon you have… well not a whole lot to be honest.  Let’s take a look at what the ECB did:

  • They lowered the rate for banks to borrow money from the ECB
  • They increased the types of collateral that banks can use to get liquidity from the ECB
  • They extended the period for banks to do long term borrowing from the ECB to 3 years and suggested they would facilitate such loans in unlimited amounts.

While these actions are somewhat helpful, what the ECB failed to do (at least directly) was to agree to buy significant quantities of government bonds.    This failure was likely responsible for the collapse in the market on Thursday.

Some have argued that the change in long term borrowing requirements will effectively let banks buy sovereign bonds on behalf of the ECB, effectively skirting the rules.  From the horse’s mouth:

There is no need to be a great specialist to understand that tomorrow, thanks to the central bank’s decision, the Italian state can ask Italian banks to finance part of its debt at rates which are undeniably lower than today’s market rates,” Sarkozy told reporters at a European Union summit on Dec. 9. “I take Italy but I could take the example of Spain. This means that each state can turn to its banks, which will have liquidity at their disposal.”

What Sarkozy is talking about is theoretically possible, however I am skeptical that it is going to be very meaningful in practice.  For one, the EU banks are already in the process of deleveraging.  By all accounts they are already too leveraged.  The process described by Sarkozy just adds more leverage.  For two, you have to think that the last kind of assets that the EU banks want more of are questionable sovereign bonds. Finally for three, if the banks decided to leverage up with even more sovereign debt all you’ve really done is doubled down on eventualy bailout that will be required when that sovereign debt goes bust.  You haven’t actually solved anything.

One of the last gasps of a Ponzi scheme is to use one investment vehicle to start purchasing the assets of another at an inflated price.  In other words, once you run out of outside suckers, you try your best to shuffle around the funds to appear solvent.  Needless to say this typically doesn’t last very long.

In all I don’t think that what the ECB did amounts to much more than a temporary blip of increased demand.  The problem of too much debt remains, liquidity to banks only helps solve the banks liquidity crisis, and the ECB still refuses to get its hands dirty by buying that debt in bulk.  However, if you want another opinion on this, on the bullish side, I think there was an excellent summary written by Savannahboy on Investors Village.

What did the EU do?

Describing what the EU did is trickier.  It is easy to get caught up in the market move upwards on Friday and assume that something significant must have happened at the meetings.  Well, I did a lot of reading and if something significant did happen, nobody told the journalists.  I suppose that the existing “plan of a plan” got tweaked and even pushed forward a couple of steps. Yet it  still remains a long way off from being a clear path to solvency.

A good Globe and Mail article by Eric Reguly reported the following summary of what was accomplished:

At least 23 of the 27 countries in the European Union – soon to be 28 with Croatia’s apparently suicidal desire to climb aboard the listing ship – agreed to a new, long-term fiscal pact designed to ensure that the euro never again gets hit with an existential crisis. (Britain isolated itself by refusing to join the deal, for fear that it would have to sacrifice the safeguards on its banking industry.)… On top of that agreement, the EU is strengthening its roster of financial stabilization tools. The EU will lend about €200-billion ($272-billion) to the International Monetary Fund, co-sponsor of the bailouts of Greece, Portugal and Ireland, to boost its firefighting capabilities. The European Stability Mechanism, the permanent bailout fund, is to launch next summer, a year earlier than originally planned, and its lending capacity is to be increased.

Reguly goes on to make what I think is the very valid point that all of these moves will do nothing to deal with the fact that the peripheral countries are not growing.

Look at Greece. Two years of austerity demanded by the EU and the ECB – read: Germany – with the IMF at their side have pushed the country to the verge of failed state status as economic activity vaporizes. The rest of the EU is slipping into recession.

With no growth, budget deficits everywhere refuse to disappear. Debt is going up. Perversely, the German-inspired response to the persistent deficits is demand for even deeper austerity. This is self-defeating, vicious-circle economics. At its worst, the lack of growth will erode the ability of the weakest countries to service their debts. Once investors figure that out, their sovereign bond yields will soar again, to the point their funding costs become unsustainable. Italy is getting close to that point.

This is key.  Markets are almost exclusively focused on what bandaid can be created to keep the banks from going belly-up next week. Perhaps the summit made some strides in this regard.  We should be able to make it through Christmas without anything catastrophic occuring.  But nothing that is being done about growth.

Jane Jacobs and the Feedback Nature of Currencies

The reality is that the fundamental problem in Europe is what brings it together in the first place: the existence of a single currency.  Italy, Greece, Spain, etc, cannot compete with Germany on a level playing field.  These countries need to have a way of leveling that reality out.  The primary (perhaps the only market based) mechanism for doing so is the relative value of the currency of each region.  If there is only one currency, there is no way to rebalance between the Eurozone countries.

This was the salient point made by Jane Jacobs years ago in her great book “Cities and the Wealth of Nations”.  In that book Jacobs begins with the basic premise that a currency is a feedback mechanism.  She goes on to argue that the problem with a country based currency is that it doesn’t allow for proper feedback of the individual cities that make up that country.   Cities within a country have a wide range of productive capacities.  What needs to occur in order to correct imbalances between cities is a readjustment of each city’s currency.

Jacobs provides a number of examples of how national or imperial currency regions usually results in one or two economically powerful cities, and a number of other dependent cities, usually requiring transfer payments of some sort to survive.

Speaking particularly of Europe she says (remember this was written in the early 1980’s):

In Italy, as time has passed since the unification of the country a century ago, the economics dominance of Milan has grown only more marked, not less so.  Even Rome itself has only a meager cioty region, vanishing a few miles south and east of the city where, immediately, the poor south of Italy begins.  In Germany before its postwar partition, Berlin had become ascendent…In France, only Paris has a significant city region now, unlike the country’s so-called eight great peripheral cities: Marseilles, Lyons, Strasbourg, Lilli, Rouen, Brest, Nantes, Bordeaux.

Outside of Europe she points to the example of Canada (Toronto and central Canada has typically grown briskly and propped up the weaker maritimes provinces), the  US (cities of the northeastern corridor typically being much stronger then those of the south), and Britian (where “the passage of time simply widened the economic gulf between [the rest of Britian] and London”) to name a few.

What Europe has embarked on with the Euro is the exact opposite of what is needed.  Currency regimes need to evolve to produce better feedback, not worse.  The Euro currency feedback mechanism is skewed by the strength of the German economy (actually more exactly the economy of its one or two prime export replacing cities, Berlin and Frankfurt).  Peripheral countries like Italy, Greece, Spain and Portugal are doomed to receive faulty feedback rather than the natural “export subsidy” that would occur if those countries had (lower value) currencies of their own.

US Housing Market

Getting away from Europe, I spent some time this weekend listening to an interesting debate at the AmeriCatalyst Housing conference.  I was introduced to this conference when I discovered some of the videos of Kyle Bass being interviewed at it.  As it turns out there is a lot of interesting stuff at the conference, not the least of which is the discussion below about the state of US housing.  This is a debate / information session put on by experts in the mortgage and housing industry.

Probably the most interesting aspect of the debate was with regard to shadow inventory.  I’ve never been totally clear on just what shadow inventory was, and it seemed to be a number that varied significantly depending on the conclusion the purveyor was trying to draw, so it was interesting to hear the comments of these experts on the concept.

The truth is that the magnitude of shadow inventory depends as much on the definition as anything.  A couple of different estimates of shadow inventory are made by different analysts.  Laurie Goodman (who I first learned of from ftAlphaville fame) pegged shadow inventory at 11M (which is an amazing 20% of housing mortgages outstanding).  Mark Fleming pegs it at 2M.  Both analyts are using the same data.

How is this possible?  Its all in the assumptions.  Shadow inventory is really just houses that are expected to go into default at some point.  There is nothing particularly nefarious about the concept, even though the name suggests it is some sort of inevitable flood of housing supply.  It may be, but it may not.  It depends on what happens.  Laurie, to come up with her 11M number, assumes a fairly large number of prime mortgage defaults, including some that are currently with LTV (loan to value) of less than 100%.   Laurie also looks at 60 day past due as her “bucket” from which to extrapolate current nonperforming loans.  Mark on the other hand, uses 90 day past due, and does not include currently performing prime mortgage defaults.

As Mark Fleming puts it, the true shadow inventory is “behaviorly perception driven”.  In other words, if the housing market begins to be viewed as bottoming, if the economy is perceived as improving, the impetus to default will be less and the shadow inventory will be on the lower end.  If the view is another lengthy recession, then expect a lot more inventory to come out of the shadows.

What it Means to the Portfolio: Lightening up on Gold

I sold out of Newmont Mining earlier this week, and I lightened up on my position in Aurizon Mining. I remain bullish of gold stocks, just not as bullish as I was.

I have been expecting that the European problems would precipitate ECB money printing.  I still believe this is going to happen, At some point that is; as I pointed out the structural flaw in the Euro currency union means that there simply is no way that Italy, Greece, Spain and Portugal (maybe even France) are going to grow themselves out of  their debt.

Nevertheless Draghi’s comments this week suggested that money printing may be a little further off into the future than I had hoped.  Without that, gold remains vulnerable to the headwind of its own price appreciation, and the damage that has done to jewelry sales.

The WSJ  had a good article on this:

India’s wedding-season gold demand has nearly disappeared as the yellow metal’s local prices have climbed to near-record levels because of a fall in the rupee’s value, sparking a rush to sell scrap during the usually peak buying period.

“There is virtually no demand for gold,” said Prithviraj Kothari, president of the Bombay Bullion Association.

I feel reasonably comfortable holding story stocks like Atna Resources and Lydian International (I also started a position in Esperenza Resources this week, though not in my online portfolio).  I feel less comfortable with Newmont, which is basically a play on the price of gold.  The same case can be made to a lessor extent with Aurizon Mines (though the reason to hold onto Aurizon is an eventual consolidation of the gold sector).

Buying the Banks

While I am reducing gold, I am buying back some of the regional bank holdings I sold off after beginning to be concerned about Europe.  The truth is, the regional banks have faired better than I would have expected during the past 6 months.  The recent bottoming of the ECRI weekly leading index, along with decent jobless claims data, suggests to me that the US economy does not have its bottom falling out.  I suspect that a muddle through for the US should be good enough to see decent price appreciation in some of these beaten up regionals.

Bank of Commerce Holdings

A bit of a punt here.

I was listening to BNN last week and I caught Contra The Herd’s Benj Gallander’s top picks.  One of them was Bank of Commerce Holding (BOCH on the Nasdaq).  I did some work this week on the company and it looked cheap (less than 10x earnings, trading at about 50% of tangible book), it had a reasonable level of nonperforming loans (3.3%), and it has the potential for better earnings in the future once it works its way through its loan loss write-downs. So I bought some.

The worry about this regional bank is its region.

The Company conducts general commercial banking business in the counties of El Dorado, Placer, Shasta, Tehama and Sacramento, California.

This is not-exactly-but-close-enough-to the inland empire that didn’t fare so well during the housing bust:

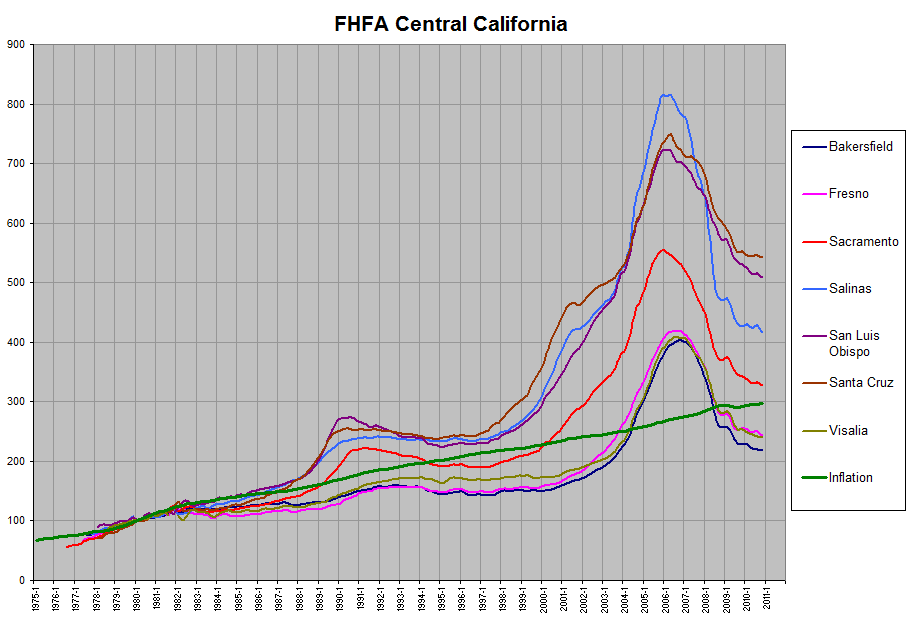
Given the circumstances, the company has done an admirable job of keeping their loan book clean thus far:

  • Nonperforming loans to total loans 3.33 %
  • Nonperforming assets to total assets 2.30%

As well ROE has been decent, particularly if you consider that the number includes the provisions to losses the company has taken:

Return on average assets (ROA) and return on average equity (ROE) for the three months ended September 30, 2011, was 0.91% and 7.45%, respectively, compared with 0.67% and 5.95%, respectively, for the three months ended September 30, 2010. ROA and ROE for the nine months ended September 30, 2011, was 0.75% and 6.45%, respectively, compared with 0.70% and 6.61%, respectively, for the nine months ended September 30, 2010.

I estimate that if you looked at ROE ex-provisions, the number would be very close to 10%.

Bids in for Oneida Financial (ONFC) and Community Bankers Trust (BTC)

While I managed to pick up a position in BOCH quite quickly, I have bids in for, but so far haven’t been able to purchase, too many shares of ONFC and BTC.  Rest assured I will wait patiently until I do.  Both of these banks represent good value, and unlike BOCH they are both in areas with stable economies and housing (Virginia for BTC, Central NY for ONFC).

In the case of Community Bankers Trust, the 3rd quarter brought the first profitable quarter in quite a while.  It also showed a continuation of the trend towards less charge-offs.

BTC trades at less than a third of tangible book value ($3.67) at this point.  Meanwhile, insiders continue to buy shares.

Oneida Financial is a NY based bank with stellar loan performance (well under 1% nonperforming assets to total assets), strong earnings performance (should earn in the neighbourhood of $0.80 this year), and is trading slightly under tangible book value of $9.10.

I am particularly impressed with Oneida’s consistency of earnings throughout this tumultuous period.

Oneida also pays a dividend of 5%.

Portfolio Composition

Stepping through the NAV of Aurizon Mines

The following post, originally published on November 23rd, 2011, has been updated to reflect the calculation of NPV after tax rather than being limited to before tax treatment only, as was the case before.

A couple of days ago I looked at the current cashflow generation capacity of Aurizon Mines. Contrary to popular market opinion (Aurizon continues to drop as though it would be bankrupt at $1500 gold), from my analysis I concluded the following:

  • …about 20% of Aurizon’s market cap is in the form of cash on the balance sheet. The enterprise value of the company is only $740M after subtracting this cash. Annualizing the last four quarters, the company is trading at about 9x its free cash flow generated. That would be using an average gold price of about $1500/oz.
  • Looking at the company on the basis of free cashflow, if you annualize the third quarter, where the realized gold price for Aurizon was $1695/oz, the company is generating free cash at a rate of $104M a year. This puts the company valuation at a little less than 7.5x free cash flow.
  • On an operating cash flow basis, in the last four quarters (when there has been an average gold price of $1500) Aurizon generated $111M of operating cash flow This gives the company a 6.6x EV/opcf multiple for the ttm. If you annualize the third quarter operating cash flow alone you get $136M, which leads to an EV/opcf multiple of 5.4x.

So those are some basic conclusions that can be drawn based on production, revenues and costs. Now I want to expand the analysis to look at what net asset value of the company.

To look at the NAV I am going to sum up all the parts of the company, subtract any liabilities and debts and then divide by the shares outstanding to estimate the value of the assets on a per share basis.

Let’s start with Casa Berardi.

Casa Berardi

Casa Berardi is Aurizon’s single producing mine.  Casa Berardi has been a steady producer over the last number of year, both in terms of produced ounces and costs.

In the current environment which has been wrought with gold companies missing cost estimates, it is particularly impressive that Aurizon has been able to actually reduce costs for the last two quarters.

Casa Berardi has the following reserves and resources

Note that some of the resource is open-pittable. The expectation is that the open pit production will begin near the end of the underground mine life when the underground is no longer supplying sufficient ore to the mill.

On March 31st Aurizon filed an updated technical report on Casa Berardi that looked specifically at the feasibility and economics of the open pit.  That report can be found on Sedar.  I have used the data in that report extensively to come up with my own estimates.

In the report the evaluators, Roscoe Postle, only considered mineral reserves for both the underground and open pit when determining the production schedule. I believe this is too conservative. I have instead incorporated 70% of the measured and indicated resource in my production profile. I have included none of the inferred resource. I believe that I am being conservative in these assumptions.

The inferred and  M+I resource that I did not include in the production profile will be added to the Aurizon NAV  based on a $/oz valuation.  These ounces will have a lower value than those included in the production model, but still have some value assigned to them.

Because some of the M+I resource was added to the production profile, the profile I used is not the same as what was used by Roscoe Postle. I basically spread out the open pit production over twice as long of the period, and overlapped the production with a reduced but extended production profile from the underground. The specifics of how Aurizon eventually will sequence the underground and the open pit are a guess to me, but I don’t think that they will dramatically effect the result I am trying to achieve, which is to understand the NAV of the company.

I determined the following after tax (AT) value for Casa Berardi:

The details of the spreadsheet I used to come up with the estimates is provided below.  The cost and processing assumptions are almost exclusively based on the Roscoe Postive report. The grades of the underground are based on the grades expected from the mine sequencing of the current reserves, and the stated grade of the M+I resource.  Open pit grades are from Roscoe.  Taxes are determined based on a 30% tax rate (includes provincial and federal tax) with depreciation deducted from the before tax income.

Joanna

Aurizon has an advanced stage development project called Joanna. The company is completing a feasibility study on Joanna as we speak. The feasibility study has taken a bit longer than anticipated because it was originally expected thta Joanna would mine the ore, form a concentrate, and then ship the ore to Casa Berardi for final processing. Aurizon got about half done the feasibility study using this assumption before the drilling results at Joanna forced them to re-evaluate. The company is now producing a feasibility study that includes full mill and processing circuit on-site.

My analysis tries to incorporate this new on-site milling. The mining and base milling assumptions were determined from the pre-feasibility study that was done for Joanna December 22nd 2009. However I updated a number of the capital and operating cost numbers to better reflect both the cost increases, the mill on-site, and to add some conservativeness. The differences are listed below:

I am probably being conservative with all these assumptions.  I’ve hiked the numbers rather substantially.

My analysis assumes ultimate production of 1.4Moz of in-situ gold (pre-recovery).  This compares with the following estimate of gold resource at Joanna.

Clearly I am being conservative in basing my work on a 10 year mine life and 8,000t/d.  There appears to have at least 2Moz and potentially 3Moz of gold in-situ.  And the deposit remains open to more exploration.

As with Casa Berardi, any M+I or inferred resource not included in the production profile will be given a valuation based on a per ounce estimate.

Like Casa Berardi, I looked at 3 gold price scenarios; the trailing four quarter gold price ($1500/oz), the current gold price $1800/oz, and a future possible rise in the gold price ($2100/oz).  Below is the before tax NPV of Joanna under each scenario.

The details of the spreadsheet I used to come up with the estimates is provided below.

Other Projects

Aurizon is involved in a number of other much earlier stage development projects.  There of these already have legitimate (albeit small) deposits.  There is exploration work being done on all three of these projects to increase the resources.  I am not going to include any of the potential in the NAV calculation, but  I will include the current resource value.

Because these projects are still years away from a feasibility type study, and because they represent a very small value in comparison to Casa Berardi and Joanna, I have chosen to value them on a very simple $/oz basis.  In the case of Marban, as part of the earn in Aurizon has to pay $30/oz M+I and $20/oz inferred for 50% of the ounces defined in the final NI 43-101.  That is why I have assigned a lower value to ounces in the Marban-Norlartic deposits.

The total value to Aurizon of these projects is about $12M.

At this point we will value the ounces that were not included in the production profile at Casa Berardi and Joanna.  The value of each ounce is somewhat arbitrary.  It really represents a risked value of what the NPV10 of that ounce would be if produced.  M+I resource is worthe more than Inferred resource.  Similarly, Casa Berardi ounces would need to be worth more than Joanna, because with a mill already built on-site and a mine in production, the risk profile of an ounce at Casa is less than at Joanna.  Another consideration is the price of gold that ounce is being valued at.  In the table below I have considered all 3 variables in my determination of the value of each ounce.

There are a number of sources that can be used to determined the average value of an ounce in the ground.  All are bound to be wrought with error bars.  One such study, performed by Edison Investment Research, drew the following conclusions:

we have been able to determine that the average value of a ‘measured’ resource ounce globally is US$340/oz, while that of an ‘indicated’ ounce is US$159/oz and that of an ‘inferred’ ounce is US$34/oz

Another study, published by Casey Research, determined some slightly lower numbers, though I suspect this was because the CaseyResearch team was mostly focused on junior exploration and development companies, or in other words companies that do not yet have a mine built, and where therefore the value of each ounce should be expected to be somewhat less:

1. Inferred: US$61.20 per ounce (up 179.5% from Dec 2010)

2. M&I: US$69.30 per ounce (up 56.4% from Dec 2010)

3. P&P: US$232.70 per ounce (up 1% from Dec 2010)

My estimates are quite conservative.  They can be seen below as a function of the gold price they are being evaluated at.

Adding it all up

The last piece of the puzzle before we add up the numbers is corporate expense.  This has been fairly consistent for Aurizon at around $15M.  I assumed a continuation of the $15M expense going forward over the 11 year mine life of the production profile I developed for Casa and Joanna.

I did not include the NPV of any exploration expenses that Aurizon will incur in the future.  I did not think it was correct to include these expenses without being able to estimate the offsetting assets they create.  Obviously we can’t hope to know what the drilling may find, so I decided to leave this expense out of the calculation entirely.

As noted above, Casa Berardi and Joanna production profiles all assume a 30% tax rate to net mining profits.  No tax rate has been assigned to the valuation of “other ounces”.  It is assumed that the $/oz number that is used for those ounces implies the value of the ounce after tax.

The individual parts can now be added up to determine the net present value of the company at various gold price scenarios.  This is shown in the two tables below, first discounted at 10% and then discounted at 5%.

A couple observations about the final result:

  • The valuation of the company is quite dependent on the price of gold.  The net asset value of the company varies by almost 50% depending on whether the valuation is done at $1500 gold or $1800 gold.  Perhaps the violent swings in the share price with each $10 move in the price of gold are not as unwarranted as I have thought?
  • The numbers vary significantly with the discount rate.  There is a 20% swing depending on whether you want to discount at 5% or 10%.  I think what this really puts in perspective more than anything is just how subjective the valuation can be.
  • Based on my assumptions, Joanna isn’t worth that much at $1500 gold.  But my asumptions are likely wildly conservative compared to what Aurzion’s upcoming feasibility study will show.  Why?  My production profile for Joanna did not include about 2Moz of resource.  I ended up valuing those ounces separately at a much lower amount.  If you add them to the production profile the value of Joanna would rise by 40-50%.
  • Aurizon is fairly priced in the $6-$8 range if you believe in $1500/oz gold for the long term.  Aurizon needs to move well into the double digits to begin to price in $2000/oz plus gold.

Overall, the work gives me confidence that there is unrealized value with Aurizon, and that if and when a gold price of $1800/oz begins to get accepted as a sustainable one, the price of the stock should move up significantly to reflect that.

A Rick Rule Example: Aurizon Mines

“Top mining companies are finally generating dramatically higher profit margin. Free cash flow is now “gushing” and will double in the next year as huge capital investments by the majors pay off.

That quote comes from a recent interview with investor Rick Rule.

The observation that gold equities are undervalued has been coming from a number of fronts of late.  Donald Coxe, David Einhorn, heck even Cramer was touting gold stocks a few months ago before his favorite, Agnico Eage, ran into stability issues at Goldex and scared Cramer silly.  Rick Rule said the following recently about the attractiveness of gold equities:

“There have only been two times in the past ten years when, from our own calculations, gold and silver equities were attractively priced relative to the metal, that being 2001 and 2008.  We are back strongly in that territory.

I believe if current gold and silver prices hold up, and I believe they are actually going to increase, that we are going to see a rather dramatic jump higher in the prices of select gold and silver equities on a go-forward basis.

The point, made best by Rule but also by others, is that gold miners are finally in the business of making money, not just producing gold.  A case and point of Rule’s comments: Aurizon Mines.

Here is a company that gets no respect from the market.  The company can release an excellent quarter, as they did two weeks ago, and the market will yawn.  If the price of gold falls a few bucks on any given day, the stock will crater 3% or more.  You’d think the company was some sort of fly-by-night chop shop given the way the market treats their paper.  Yet nothing could be further from the truth.

Below is Aurizon’s free cash flow and cash on hand on a quarterly basis.  Free cash flow is cash flow from operations less capital expenditures. Keep in mind that at its current price of $5.80, Aurizon has a market capitalization of $940M and no debt.

The free cash is allowing the company to grow its cash on hand significantly every quarter.

As the above figure points out, about 20% of Aurizon’s market cap is in the form of cash on the balance sheet.  The enterprise value of the company is only $740M after subtracting this cash.  Annualizing the last four quarters, the company is trading at about 9x its free cash flow generated.  That would be using an average gold price of about $1500/oz.

If you annualize the third quarter, where the realized gold price for Aurizon was $1695/oz, the company is generating $104M in free cash a year.  This puts the companyvaluation at a little less than 7.5x free cash flow.

It is important to recognize that what I am talking about here is free cash flow.  This is different then the metric that is often touted by the mining analysts in their evaluations.  They focus on the operating cash flow, which ignores any capital expenditures a company has.  I’ve chosen to look at free cash because:

  1. As I pointed out last week in my comparison between Jaguar Mining and Aurizon, companies generating similar amounts of operating cash flow can have drastically different expenditures required to maintain that level of cash flow.
  2. Free cash is what ultimately goes to the bottom line and increases the cash position of the company.

If I was going to look at cash flow from operations for Aurizon, here is what I would find.  In the estimates below I have removed the exploration expense to get a true picture of cash flow from operations.  Exploration expense is a tricky beast, because a company can choose to expense or capitalize the cost, which can work to obscure comparisons.  I prefer to leave it out when talking about operating cash flow (though I left it in when we talk about free cash).

  • In the last four quarters Aurizon generated $111M of operating cash flow (6.6x)
  • Third quarter annualized operating cash flow was $136M (5.4x)

On either metric the equity is cheap.

So Aurizon is cheap on a basis of four quarter trailing gold prices (~$1500/oz) and certainly on the basis of current gold prices $1700/oz.  I am certain that if you did the same analysis for other gold companies you would draw similar conclusions.  Some would come out astoundingly cheap.  OceanaGold comes to mind as a gold producer priced particularly inefficiently.

The next step I want to focus on is how Aurizon looks on a NAV basis.  Cash flow is the metric to evaluate current profitability, but to fully appreciate all the assets of the company, and the productive life of those assets, you have to look beyond the current cash flow and into the expected cash generated in the future.  But I will leave that for a later post.

Week 19: Liquidating Jaguar, Adding to Atna, Aurizon

Last week was another good week for my portfolio.  I tend to perform well in sideways markets.  In down markets, especially those like we’ve had recently where the correlation of all asset classes go to one, I tend to underperform on an individual equity basis, because the stocks I own are for the most part small caps and commodity stocks, and they get hit harder than the broader market.   I’m trying to mitigate that with my currently high cash position, and it has done its job and  dampened the effect.

I would, however, like to reduce my cash position at some point, as it is har d to make money when so much of it is doing nothing.  To do that though I would have to see some sort of light at the end of the European tunnel, and that is not likely forthcoming.

The only significant portfolio change I made last week was to sell my position in Jaguar Mining, and using the subsequent cash to increase in my positions in both Aurizon Mines and Atna Resources.  There will be more to come on both Atna and Aurizon in a future post.  I see Atna in particular as a interesting and soemwhat unique situation.   Atna recently received 100% interest in the Pinson deposit.  This is a game-changer for the company, and one that is not even close to being priced into the stock price.  Because Pinson does not have a full feasibility study complete, or even a PEA, investors are not aware of the economics of this high grade underground project.  But more on this later.  For now though I want to spend a few minutes talking about Jaguar Mining.  Since I have written about the company fairly extensively, I think its worthwhile to review why I have now chosen to go the path of full liquidation.

I can point to a number of reasons for getting out of Jaguar Mining.  At the top of that list is the company’s inability to generate free cashflow, even though the gold price has risen some 40% over the past 9 months.   The way that Jaguar has managed to match any increases in operating cash flow with correpsonding increases in capital outlays is uncanny.

Let’s compare this to another holding of mine, Aurizon Mines.

Aurizon, on the other hand, has done exactly what you’d expect a company to do in a rising gold price environment.  They have generated a great deal of cash.  The cash position of Aurizon has increased almost $40M since the beginning of the year.  Jaguar’s cash position, on the other hand, has actually decreased if you remove the effect of the convertible denbenture issued in the first quarter.

Of the two companies, the one that you would have to say is in a better position for expansion would be Aurizon.  But never a management team to be daunted by lack of available funds, Jaguar said in a separate press release that they are going forward with the development of the Gurupi project.

At the beginning of the year Jaguar provided a longer term outlook  of what to expect from the company.  I’ve provided one of the tables from this outlook below.  Pay particular attention to the requirements of Gurupi (which as the table indicates was supposed to start development this year, by the way), an estimate that one analyst on the conference call referred to as outdated and not in the “that number is too high” kind of way.

Jaguar is going to be forced to raise a lot more capital to fund Gurupi.

On top of that, Jaguar plans to refinance their outstanding debentures with senior debt.  Between the Gurupi financing and the convertible refinancing Jaguar is looking at a bond offering of $400M+.  This seems like a bit of a heroic expectation for a company that is struggling to produce any free cash flow at record high gold prices.

Another analyst on the call pointed out that the market might not be quite as responsive to new debt from the company as Jaguar management seems to think it might be.  Quite reasonably, the analyst referred to the existing debentures, which the market is currently valuing at a 13% interest rate.  He speculated that the market is suggesting that Jaguar debt would take a 15-17% coupon.

Management said that the offer sheets they had received were in the 9-11% range.  Forgetting for a minute that 9-11% interest rates are extremely high, you have to be a bit suspicious of the company’s ability to raise money at this level when there are debentures outstanding that carry the upside conversion option, at a 20-40% discount.

I could go on.

I bought Jaguar because in the low $4’s it was a undervalued NAV play.  The projects, if you tally up the value of each, are worth around $6-$7 per share, and maybe more at $1800 gold.  But at $6 per share, which is about the average price that I unloaded my position at, that NAV story is replaced by a cashflow story that to be quite frank about it, just isn’t there.

I’ll stick with Aurizon, with Atna, and with the big boys like Newmont and Barrick.