The Total Cost of Producing Gold
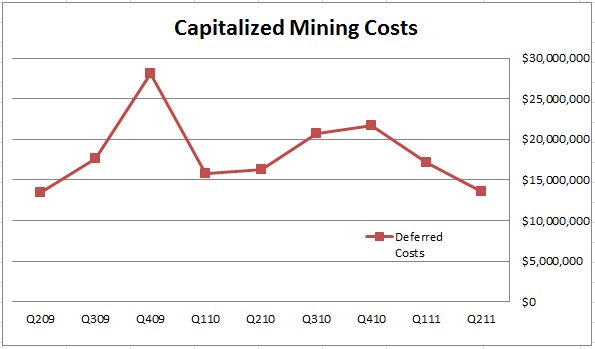
Last month I wrote a post about the second quarter results from OceanaGold . In that post I looked at the company’s assertion that the quarter was not as bad as it appeared on the surface because the total mining costs had not changed significantly. What had changed was that more of the costs were being expensed and less of the costs were being capitalized. Below was a chart I provided showing how OceanaGold’s capitalized mining costs had varied over the course of the last couple of years.
To generalize the point of that post, looking strictly at expensed costs (cash costs) as a judge of a company’s quarterly performance has its flaws.
So just to refresh, the difference between expensed and capital costs is as follows. Expensed costs show up on the income statement and factor into the commonly evaluated cash cost number for a company. Under most accounting methodologies these are the costs that can be directly attributed to the ore being mined. Capitalized costs, on the other hand, are hidden on the cash flow statement under the Financial Activities, usually showing up as Property, Plant and Equipment. They can be one time charges such as a new pinion bearing housing on the ball mill, or they can be pre-mining expenses such as the stripping away of overburden to get to ore that will be mined later.
While the expensed costs get all the headlines, the capitalized costs don’t get much attention at all. Yet both types of costs are equal in the place where it really counts: how the company’s cash balance changes from quarter to quarter.
The work I did for OceanaGold led me to wonder what the same sort of analysis would look like for other gold companies. What are the total costs of mining on a quarterly basis and how do they differ from the reported (expensed) cash costs that get so much attention from the brokerage community? What we are really interested in with any company is how much free cash they can generate. If a company is generating a lot of operating cash but is plowing that cash right back into the mine as sustaining capital, well then they are running on the spot. So total costs is what matters, be they lumpier and messier than cash costs or not.
Moreover I have to imagine that there is grey area when applying the criteria of what constitutes an expensed cost and what constitutes a capitalized cost. The implementation whatever accounting methodology is used probably varies from company to company. Simply looking at cash costs might ignore these discrepancies and paint a poor picture of what’s really going on in the operations.
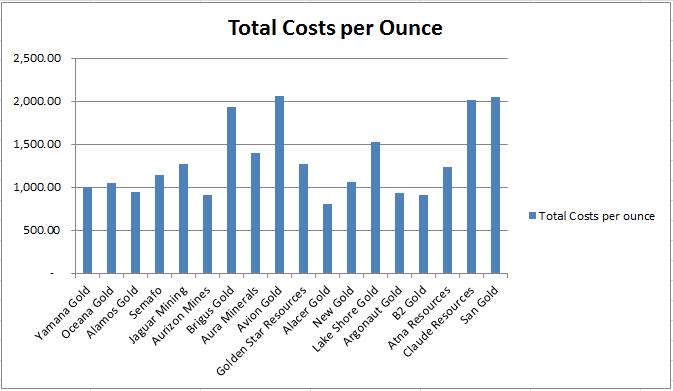
To look at the effect of overall costs, what I have done is simply this. I took the cash costs stated by each company for the last two quarters and added to those costs the additions to property, plant and equipment as reported on their cashflow statement. Then I divided summation of these two costs by the ounces produced over the first two quarters. Because PP&A is likely to be more variable, it might be worthwhile to do this over a longer time horizon, but for now this will have to suffice.

This is an interesting result. It is particularly interesting when you compare the list against the same list of companies sorted on the more traditional cast costs metric.

What you see is that the companies that are lowest on the cash cost scale are not necessarily the lowest on the total costs scale.
Now of course, like everything, these results have to be taken with a grain of salt. One of the reasons that capitalized costs are not added to cash costs in for traditional analysis is because they are inherently lumpy. One time purchases that should be capitalized could skew the picture of the quarterly performance of a company. Brigus Gold is a good example of this. They are ramping up their underground mine at Black Fox right now. There are a lot of capitalized costs associated with that ramp up.
I went another step further by looking at costs for the full year 2010. That graph is shown below. Here a few of the companies (Lake Shore, Atna, Alacer, etc) drop off the list because they didn’t have comparable production for the period for one reason or another.

To make a few observations from the above graphs, the first being that OceanaGold does not look like such a high cost producer. While their cash costs are higher than the norm, their capitalized costs have consistently been lower than normal. I wonder how much this is caused by having a mature mine.
Another observation I would make is that Aurizon Mines truly is a (if not the) low cost producer. Both OceanaGold and Aurizon Mine are cash generators, which should serve them well over the longer term as they develop their mines.
A final observation is that B2Gold is worth taking a closer look at.


