Trying to be Better at Evaluating Banks – PNC
In my last post I made a decidedly poor attempt of figuring out where the banks are going.
I didn’t think through my assumptions. Because of that my guesstimates were off. When I thought about it more, I realized that I was effectively using the average loan interest rate for the entire year 2022. That meant that my average included about half a year of very low rates. And this meant that I was using an inaccurate depiction of earnings sensitivity going forward.
Hopefully I do a better job this time.
We have seen the reports of a few banks for the first quarter. I can use Q1 numbers to look at the same sort of sensitivity as I did before, but with more detail and more recent baselines. If I make some assumptions about where deposit rates might go, I can come up with where earnings might go – hopefully with more accuracy than before.
I am going to start with one of the bigger regional banks that has reported, PNC Financial.
PNC is not anywhere close to the center of the deposit runs we had in March. It is safe to assume that PNC is more likely to have deposits run to them than run away.
You saw some of that in Q1. PNC saw deposits grow QoQ.
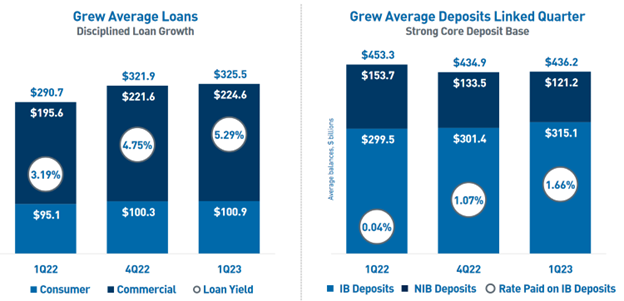
Clearly there is no “bank run” concern here. The concern, if there is one, has to do with what those deposits are going to cost in the next few quarters and how much that is going to hit their bottom line.
PNC provided very good color around both their deposits and their loan book this quarter. That is why I am using them as a test-case of sorts. The earnings reports of smaller banks are hard to figure out until the 10-Q is released.Let’s start with PNC’s guidance. This is what they are guiding to in 2023.
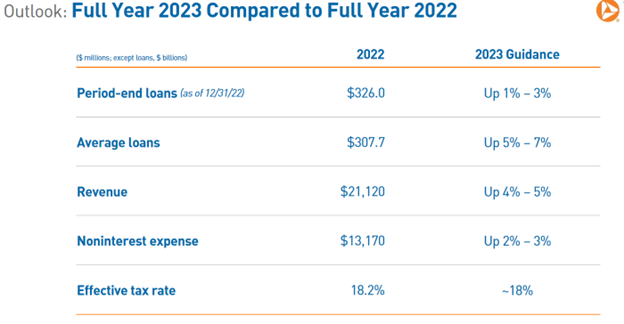
It is not a ton of detail, but along with the deposit information below, it is enough.

What I have done below is extrapolate earnings from PNC’s guidance. This estimate is based on deposit beta (remember, beta is how much interest bearing deposits increase as a fraction of Fed Funds rate) guidance of 0.42 by year end (I used 0.39 as the average for the year), a Fed Funds rate peaking at 5.5% and an average of 25% non-interest bearing deposits (NIBs).
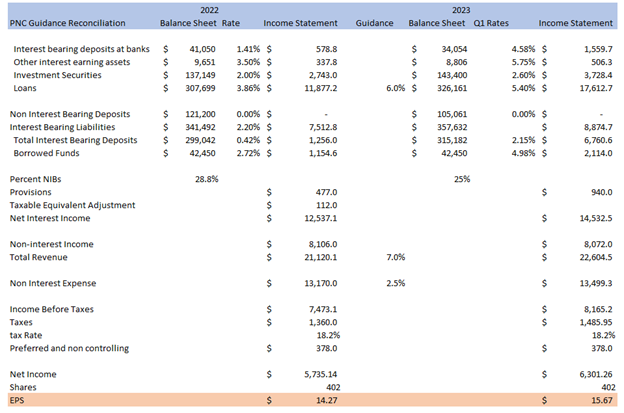
The resulting earnings look pretty good. Up 10% YoY.
So why is the stock only $124? Why does it trade at a 7.9x PE?
The two things that come to mind are:
- the market is pricing in much bigger earnings hit, presumably by rising deposit costs.
- the market is pricing in big defaults
Let’s look at deposits. What happens to PNC earnings when deposit costs go up a lot?
Below is PNC with a deposit beta of 60% (instead of 39%) and with non-interest bearing deposits dropping to only 20% of total deposits (instead of 25%).
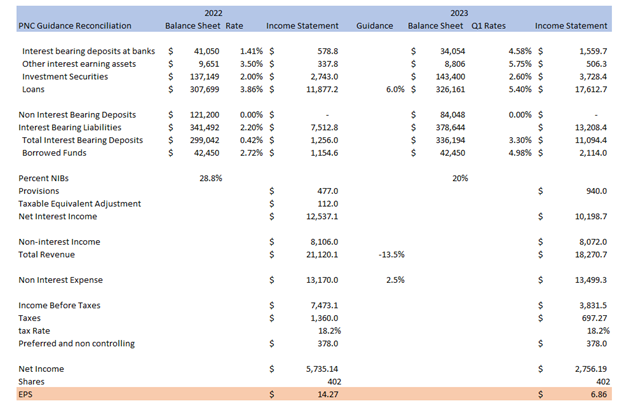
It has a large impact on earnings. But even with an extreme assumption, it is no death blow. It puts PNC at an 18x PE.
Moreover, this assumption seems quite extreme. Deposit betas of 60% would mean the average rate for PNC’s interest bearing deposits would go to 3.3%. In Q1 it was 1.66%. That’s a huge jump. Is that really realistic?
I doubt it.
What I see right now are two worlds. There are banks paying high deposit rates and banks paying low deposit rates. PNC is, of course, in the latter group. Here is where the banks in my watchlist sit so far:

The other possibility is that the market is worried about credit losses. Which is always the great unknown for a bank.
PNC gave a lot of information about potential credit losses in their Q1 report.
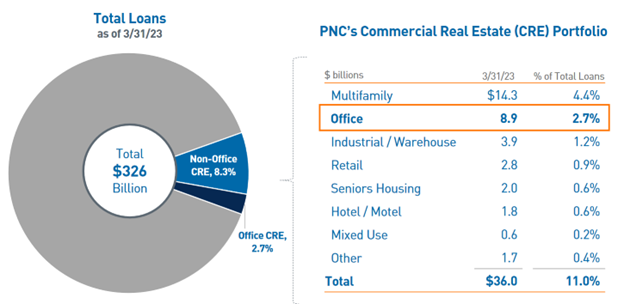
The biggest worry with loans comes from commercial real estate. Within the CRE bucket the biggest worry is office. Office makes up $8.9 billion of PNC’s loans – or 2.7% of total loans.
Of course, while office is not a lot of the whole, $8.9 billion is still a lot. But those office loans have a lot of buffer.
PNC gave a very detailed summary of their loan origination practices on the call:
Reserves against these loans, which we have built over several quarters, now totaled 7.1%, a level that we believe adequately covers expected losses. In regard to our underwriting approach, we adhere to conservative standards, focus on attractive markets and work with experienced, well-capitalized sponsors. The office portfolio was originated with an approximate loan to value of 55% to 60%, and a significant majority of those properties are defined as Class A.
We have a highly experienced team that is reviewing each asset in the portfolio to set appropriate action plans and test reserve adequacy. We don’t solely rely on third-party appraisals, which will naturally be slow to adjust to the rapidly shifting market conditions. Rather, we are stress testing property performance to set realistic expectations. To appropriately sensitize our portfolio, we’ve significantly discounted net operating income levels and property values across the entire office book. Additionally, tenant retention, build-out costs and concession levels are all updated to accurately reflect market conditions.
Credit quality in our office portfolio remains strong today with only 0.2% of loans delinquent, 3.5% nonperforming and a net charge-off rate of 47 basis points over the last 12 months. Along those lines, we continue to see solid performance within the single tenant, medical and government loans, which represent 40% of our total office portfolio. These have occupancy levels above 90% and (inaudible) levels of 3% or less. Where we do see increasing stress and a rising level of criticized assets, is in our multi-tenant loans, which represents 58% of our office portfolio. Multi-tenant loans are currently running in the mid-70% occupancy range. (inaudible) levels are greater than 30% and 60% of the portfolio is scheduled to mature by the end of 2024.
In the near term, this is our primary concern area as it relates to expected losses and by extension, comprises the largest portion of our office reserves. Multi-tenant reserves on a stand-alone basis are 9.4%. Obviously, we’ll continue to monitor and review our assumptions to ensure they reflect real-time market conditions.
The key points here are:
- They’ve already reserved 7% on these loans
- Loan to value is 55% to 60% on these loans
- They have already significantly discounted net operating income levels and property values
- Right now there are 0.2% delinquent, 3.5% non-performing
- 40% of the portfolio is single tenant, medical and government loans
I sat on this post for the last day thinking about what else could go wrong. I mean, there is always the possibility of a 2008 style liquidity squeeze, and of course if that happens, all bets are off on the stock.
But absent something truly systemic, I just can’t see why the stock would have another leg down. And if it doesn’t go down, it should eventually go up.
So we’ll see. I’m quite interested to see how this plays out. As much to see what I may have missed as to see if I’m right.


