Skip to content

Posts from the ‘Atna Resources (ATN)’ Category

Week 22: Still Partial to Cash

(see end of post for current portfolio composition)

When you are 57% cash, its difficult to outperform the market to the upside.

That is exactly what happened this week.  The TSX was up 5%, the S&P up 6%, the Venture up 3.3%, and my portfolio was up a lowly 2.9%.  Having as much cash as I do certainly has protected me against the downward trend over the last 4 months, but it will also prevent my portfolio from having outsized gains if we have a significant rally.

I Remain Wary of Europe

I am, however, in no mood to change my tact.  Though I admit that the developments this week were constructive, and they could very well lead to a continuation of the market rally.  In the short term, the dollar liquidity provided by the central banks will allow the European banks to fund themselves for a while longer. Probably more important, Mario Draghi’s statement below, clipped from this WSJ blog post, sets the stage for rate cuts and at least raises the possibility of a QE of sorts out of Europe

Yesterday, Mr. Draghi made a statement that we find tectonic-plating-shifting-like in nature when he said firstly that the “Downside risks to the economic outlook have increased.” They have indeed, and we’ve no problem with what he said for that is indeed the truth. Then, however, the plates shifted when he said, noting that the ECB’s mandate, that price stability is to be maintained “in both directions.” In other words, the ECB’s mandate forces the authorities to be concerned about deflationary risks as well as those inflationary. Did you hear the plates shifting? You should have for they have indeed shifted. Draghi’s warning was that the authorities are just as concerned about deflation as inflation and that monetary expansion is to be considered just as has monetary contraction.

Yet if anything I am less inclined to add to investments.  I am more convinced that the outcome is Europe is close at hand, and the while a positive resolution (assuming there is such a thing) would lead to a continuation in the move to the upside, the risk still remains that the resolution won’t be positive.  I am sure in such a case everything (save the USD and treasuries) will go down.

Bass Talks Again at AmeriCatalyst Conference

Case and point is Kyle Bass, who in my opinion has the clearest explanation of the problems in Europe.  He was again at the AmeriCatalyst conference this year, and a few days ago the segment was postedto youtube.

One of the interesting points that Bass makes is that while Greece bonds are trading at astronomical interest rates, the actual rate of interest the Greeks pay is a little more than 4%.  At thta interest rate, interest payments in Greece are 16% of government revenues.  This was basically the tipping point of no return for the country.

It reminded me of something I wrote in my analysis of Italy a few weeks ago:

According to Italy’s Ministry of Economy and Finance, Italy’s outstanding debt is around E1.85B or USD$2.5t (2010 figure but Italy is close to a balanced budget so its probably nearly the same this year).  Government revenues in 2010 were E729B or  USD$950B.  To do a little simple math then, every increase in the Italian rate of borrowing of 1% results in an eventual increase in borrowing costs for Italy of about $25B, or about 2.5% of government revenues.

In 2010 Italy paid E80B in interest expenditures. So right now the average interest rate that Italy is paying is about 4.3%.  A 1% rise therefore raises the average interest rate to 5.3%…Once the market starts to determine that you are on a road to insolvency, its pretty easy to get pushed on the fast track.  In the case of Italy, 6% is starting to get closer to 7% every day.  If yields rose 3-4%, then Italy would begin to have a problem with the interest that had to pay on their debt.

The problem that I alluded to above is that when you have as much debt as Italy has (or for that matter Greece or Portugal or Japan or even the United States has), your ability to pay that debt is as much determined by the market’s perception of how able you are to pay your debt as it is of anything.

I also noted that “if yields rose 3-4%, then Italy would begin to have a problem with the interest that they had to pay on their debt”.  Well here we are.  Right now Italy has interest payment that are a little under 11% of government revenues.  At 8% interest rates, Italy would eventually soar past Greece’s paltry 16% of revenues on a path that would eventually lead them above 20% of revenues.  Hmmm….

Is the Gold There?

Another very interesting clip from the interview occurs at the 42 minute mark.  If you don’t listen to any other part of the interview, I would beg you to listen to this.   Bass gets asked why he decided to take delivery of the gold futures he held on the Comex.  He explains how he looked into the situation at the Comex.  Turns out they had $80B of open interest and $2.7B of deliverables.   This seemed to him to be slightly underfunded.   He went to the head of delivery’s at the Comex and asks what they would do if suddenly everybody (or at least 4% of contract holders) wanted to take delivery.  The response he gets is A. “Oh Kyle that never happens, we rarely get 1% of contracts taking delivery”, and B. price would fix the problem.

In other words: there is no plan for what to do if everyone wants to take delivery.

This is one of those situations that isn’t  a problem until it is a problem and so far it isn’t a problem.  But when it becomes a problem, and when Comex or whatever clearinghouse that has teh problem has to pony up more gold then it has, well that is the definition of a squeeze.  But maybe this never happens.    If it does happen, price is going to do something, and that is go straight up.

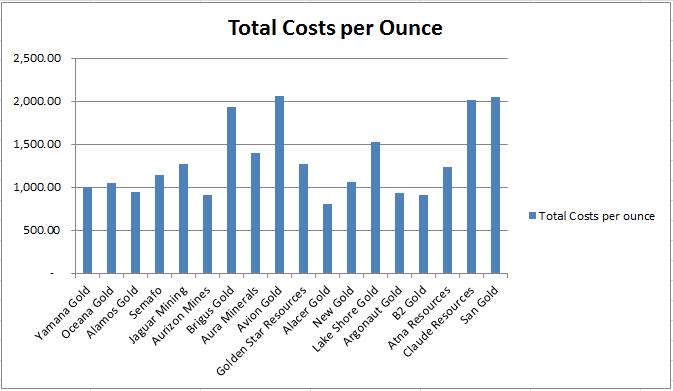
The Best Bargain Among the Gold Stocks

I have been working through an analysis of Atna and while I am not quite ready to post that analysis, I am ready to say that I believe Atna is the best way of playing a bet on sustainable gold prices at $1500/oz or higher.  As I have dug deeper into the company I have been surprised with just how many assets they have.  In addition to a producing mine (Briggs) and a low capital cost, high grade development (Pinson), they have over 1Moz of gold in Montana (Columbia), 300Koz of oxidized resource and based on recent drill results more to come at Reward, and another 150Koz of oxidized resource a few miles away from Briggs at Cecil.   And those are just the properties with a known resource.  In addition they have a score of properties with exploration potential, including a few that are signed off as JV’s to be drilled using other people’s money.

In the analysis I will post later I will get deeper in the net asset value of the company, but for now consider the following table. With Atna, for a price of about $100M enterprise value, you are getting around 5Moz of total resource, of which the majority is either very high grade (Pinson) or has open pit heap leaching potential (Briggs, Reward, Cecil).  All to be had for $20/oz.

I plan to increase my position in Atna even further.  I could forsee a time when it is primary vehicle for investing in gold.

Portfolio Changes

As I posted earlier this week, I’ve reduced down my position in Arcan Resouces substantially.  I now basically have equivalent positions in 3 domestic oil producing juniors, Arcan, Reliable Energy, and Equal Energy.  Consider this to be my oil junior basket.  I own much more of Coastal Energy.  I have no plans to reduce my position there.  Coastal remains the single best oil investment out there in my opinion.  They are self-funding, are increasing their reserves with every well, and trade reasonably at $98,000 per flowing boe, and far below their NAV (the NPV10 as per the 2011 reserve report was $10.42 per share, since that time they have increased proved and probable reserves from 25mmbbl to over 90mmbbl.

Portfolio

Atna Releases Q3 and Moves Ahead in a Big Way

I had been waiting to post more on Atna until I finished the analysis of Pinson I have been working on, but today Atna released their 3rd quarter results today and they were strong.  I bought some more stock on the results, and I wanted to post a summary of what the quarter was like and why things are looking good for the company.

Atna’s one operating mine, the Briggs mine in Nevada sold 9,700oz of gold.  This was 2,000 oz more than Q2. Production has been increasing steadily for 3 quarters now.

Cash costs as stated on the income statement were stable the last two quarters, albeit still fairly high, at $924/oz of gold sold (Atna calculates costs based on produced gold and also subtracts silver credits so the cash flow number that will come out with the MD&A will vary somewhat from my estimate).

What is most impressive about the quarter is the cash generation of Briggs. The Briggs mine produced $7.4M of operating cash flow.  Below is the corporate cash flow generation of the company.

The cash generation of the company is going to go a long ways to financing the development of Pinson.  Capex spent in the quarter jumped substantially, suggesting that Atna has already moved ahead with starting mine development.

Even with the expenditures the company ended the quarter with a cash position of $10.5M

Atna is in the enviable position of having a stable producing mine that is throwing off enough free cash to fund the development of their star project, Pinson.  I’ll write more about Pinson shortly, but even ignoring that eventual production, the Briggs mine is now producing at a rate of almost 40,000 oz per year.  The company has a market cap of a little over $100M and with debt only $120M (see financial structure below).  A 40,000 oz producer trading at $100M is a reasonable deal in its own right.

If you add Pinson to the mix, not even to mention the potential of a 3rd mine in a few years at Reward, you have the makings of a very cheap stock.   Given the growth prospects of the company, if you believe in a rising or even stable price of gold, you have to like what you see.

Week 19: Liquidating Jaguar, Adding to Atna, Aurizon

Last week was another good week for my portfolio.  I tend to perform well in sideways markets.  In down markets, especially those like we’ve had recently where the correlation of all asset classes go to one, I tend to underperform on an individual equity basis, because the stocks I own are for the most part small caps and commodity stocks, and they get hit harder than the broader market.   I’m trying to mitigate that with my currently high cash position, and it has done its job and  dampened the effect.

I would, however, like to reduce my cash position at some point, as it is har d to make money when so much of it is doing nothing.  To do that though I would have to see some sort of light at the end of the European tunnel, and that is not likely forthcoming.

The only significant portfolio change I made last week was to sell my position in Jaguar Mining, and using the subsequent cash to increase in my positions in both Aurizon Mines and Atna Resources.  There will be more to come on both Atna and Aurizon in a future post.  I see Atna in particular as a interesting and soemwhat unique situation.   Atna recently received 100% interest in the Pinson deposit.  This is a game-changer for the company, and one that is not even close to being priced into the stock price.  Because Pinson does not have a full feasibility study complete, or even a PEA, investors are not aware of the economics of this high grade underground project.  But more on this later.  For now though I want to spend a few minutes talking about Jaguar Mining.  Since I have written about the company fairly extensively, I think its worthwhile to review why I have now chosen to go the path of full liquidation.

I can point to a number of reasons for getting out of Jaguar Mining.  At the top of that list is the company’s inability to generate free cashflow, even though the gold price has risen some 40% over the past 9 months.   The way that Jaguar has managed to match any increases in operating cash flow with correpsonding increases in capital outlays is uncanny.

Let’s compare this to another holding of mine, Aurizon Mines.

Aurizon, on the other hand, has done exactly what you’d expect a company to do in a rising gold price environment.  They have generated a great deal of cash.  The cash position of Aurizon has increased almost $40M since the beginning of the year.  Jaguar’s cash position, on the other hand, has actually decreased if you remove the effect of the convertible denbenture issued in the first quarter.

Of the two companies, the one that you would have to say is in a better position for expansion would be Aurizon.  But never a management team to be daunted by lack of available funds, Jaguar said in a separate press release that they are going forward with the development of the Gurupi project.

At the beginning of the year Jaguar provided a longer term outlook  of what to expect from the company.  I’ve provided one of the tables from this outlook below.  Pay particular attention to the requirements of Gurupi (which as the table indicates was supposed to start development this year, by the way), an estimate that one analyst on the conference call referred to as outdated and not in the “that number is too high” kind of way.

Jaguar is going to be forced to raise a lot more capital to fund Gurupi.

On top of that, Jaguar plans to refinance their outstanding debentures with senior debt.  Between the Gurupi financing and the convertible refinancing Jaguar is looking at a bond offering of $400M+.  This seems like a bit of a heroic expectation for a company that is struggling to produce any free cash flow at record high gold prices.

Another analyst on the call pointed out that the market might not be quite as responsive to new debt from the company as Jaguar management seems to think it might be.  Quite reasonably, the analyst referred to the existing debentures, which the market is currently valuing at a 13% interest rate.  He speculated that the market is suggesting that Jaguar debt would take a 15-17% coupon.

Management said that the offer sheets they had received were in the 9-11% range.  Forgetting for a minute that 9-11% interest rates are extremely high, you have to be a bit suspicious of the company’s ability to raise money at this level when there are debentures outstanding that carry the upside conversion option, at a 20-40% discount.

I could go on.

I bought Jaguar because in the low $4’s it was a undervalued NAV play.  The projects, if you tally up the value of each, are worth around $6-$7 per share, and maybe more at $1800 gold.  But at $6 per share, which is about the average price that I unloaded my position at, that NAV story is replaced by a cashflow story that to be quite frank about it, just isn’t there.

I’ll stick with Aurizon, with Atna, and with the big boys like Newmont and Barrick.

The Total Cost of Producing Gold

Last month I wrote a post about the second quarter results from OceanaGold .  In that post I looked at the company’s assertion that the quarter was not as bad as it appeared on the surface because the total mining costs had not changed significantly.  What had changed was that more of the costs were being expensed and less of the costs were being capitalized.  Below was a chart I provided showing how OceanaGold’s capitalized mining costs had varied over the course of the last couple of years.

To generalize the point of that post, looking strictly at expensed costs (cash costs) as a judge of a company’s quarterly performance has its flaws.

So just to refresh, the difference between expensed and capital costs is as follows.  Expensed costs show up on the income statement and factor into the commonly evaluated cash cost number for a company.  Under most accounting methodologies these are the costs that can be directly attributed to the ore being mined.  Capitalized costs, on the other hand, are hidden on the cash flow statement under the Financial Activities, usually showing up as Property, Plant and Equipment.  They can be one time charges such as a new pinion bearing housing on the ball mill, or they can be pre-mining expenses such as the stripping away of overburden to get to ore that will be mined later.

While the expensed costs get all the headlines, the capitalized costs don’t get much attention at all.  Yet both types of costs are equal in the place where it really counts: how the company’s cash balance changes from quarter to quarter.

The work I did for OceanaGold led me to wonder what the same sort of analysis would look like for other gold companies.  What are the total costs of mining on a quarterly basis and how do they differ from the reported (expensed) cash costs that get so much attention from the brokerage community?  What we are really interested in with any company is how much free cash they can generate.  If a company is generating a lot of operating cash but is plowing that cash right back into the mine as sustaining capital, well then they are running on the spot.  So total costs is what matters, be they lumpier and messier than cash costs or not.

Moreover I have to imagine that there is grey area when applying the criteria of what constitutes an expensed cost and what constitutes a capitalized cost.  The implementation whatever accounting methodology is used probably varies from company to company.  Simply looking at cash costs might ignore these discrepancies and paint a poor picture of what’s really going on in the operations.

To look at the effect of overall costs, what I have done is simply this.  I took the cash costs stated by each company for the last two quarters and added to those costs the additions to property, plant and equipment as reported on their cashflow statement.  Then I divided summation of these two costs by the ounces produced over the first two quarters.  Because PP&A is likely to be more variable, it might be worthwhile to do this over a longer time horizon, but for now this will have to suffice.


  This is an interesting result.  It is particularly interesting when you compare the list against the same list of companies sorted on the more traditional cast costs metric.

What you see is that the companies that are lowest on the cash cost scale are not necessarily the lowest on the total costs scale.

Now of course, like everything, these results have to be taken with a grain of salt.  One of the reasons that capitalized costs are not added to cash costs in for traditional analysis is because they are inherently lumpy.  One time purchases that should be capitalized could skew the picture of the quarterly performance of a company.  Brigus Gold is a good example of this.  They are ramping up their underground mine at Black Fox right now.  There are a lot of capitalized costs associated with that ramp up.

I went another step further by looking at costs for the full year 2010.  That graph is shown below.  Here a few of the companies (Lake Shore, Atna, Alacer, etc) drop off the list because they didn’t have comparable production for the period for one reason or another.

To make a few observations from the above graphs, the first being that OceanaGold does not look like such a high cost producer.  While their cash costs are higher than the norm, their capitalized costs have consistently been lower than normal.  I wonder how much this is caused by having a mature mine.

Another observation I would make is that Aurizon Mines truly is a (if not the) low cost producer.  Both OceanaGold and Aurizon Mine are cash generators, which should serve them well over the longer term as they develop their mines.

A final observation is that B2Gold is worth taking a closer look at.