Skip to content

Posts from the ‘OceanaGold (OGC)’ Category

Week 20: Back into Gramercy, Adding to OceanaGold

This week I finally got my order filled for Gramercy Capital at $2.75.   Plan Maestro had another excellent write-up on Gramercy last month.  CDO-2005 did relapse and fail its over-collateralization test.  This may have something do to with the weakness in the stock.  Still, the stock has a net asset value somewhere north of $5.  And Bloomberg has had two articles in the past two months commenting on the likely sale of the company to private equity.  I feel comfortable holding shares bought at this level and waiting for such a buyout.

While on the subject of US real estate, I began to review some of the regional and community banks this week.  Community Bankers Trust, which released Q3 results last week, appears to be on the upswing.  The stock remains extremely cheap based on tangible book value or earnings potential.  I do not own any regional banks shares at the moment but it may be something worth looking at in the next (inevitable) downdraft.

I added to my position in OceanaGold on Friday.  I have had a standing bid in for OGC.to at $2.21, and it was filled.  This stock seems range bound between about $2.20 and $2.70.  I’m not sure why it cannot break higher.  I posted Sunday about the cash generation capabilities of Aurizon Mines.  I could have just as easily written about OceanaGold.  The only difference between Aurizon and OceanaGold is that Aurizon can continue to generate cash at lower gold prices.  In addition, OceanaGold’s costs get misinterpreted to be higher than they actually are because

  1. so much of them are being expensed right now, as opposed to capitalized.
  2. They are in NZD, which has been perhaps the strongest currency in the world this year

Absent these two factors, the first of which is really just smoke and mirrors, and the stock would be trading substantially higher.  As it is I am picking up a company with growing production, likely lower costs (the NZD is down from 83 to 78 so far this quarter), and doing it at the lower end of the trading range.

The last trade I made did not show up in the practice account but will next week.  On Friday I sold 1/3 of my position in Arcan and planto use the proceeds to buy Midway.   I have nothing negative to say about Arcan.  They appear on-track.  Nevertheless, Midway is a cheaper stock right now, especially after the recent steep drop.  Midway also appears to be a good takeover candidate to me, so I don’t mind being diversified in case of such an event.

The Total Cost of Producing Gold

Last month I wrote a post about the second quarter results from OceanaGold .  In that post I looked at the company’s assertion that the quarter was not as bad as it appeared on the surface because the total mining costs had not changed significantly.  What had changed was that more of the costs were being expensed and less of the costs were being capitalized.  Below was a chart I provided showing how OceanaGold’s capitalized mining costs had varied over the course of the last couple of years.

To generalize the point of that post, looking strictly at expensed costs (cash costs) as a judge of a company’s quarterly performance has its flaws.

So just to refresh, the difference between expensed and capital costs is as follows.  Expensed costs show up on the income statement and factor into the commonly evaluated cash cost number for a company.  Under most accounting methodologies these are the costs that can be directly attributed to the ore being mined.  Capitalized costs, on the other hand, are hidden on the cash flow statement under the Financial Activities, usually showing up as Property, Plant and Equipment.  They can be one time charges such as a new pinion bearing housing on the ball mill, or they can be pre-mining expenses such as the stripping away of overburden to get to ore that will be mined later.

While the expensed costs get all the headlines, the capitalized costs don’t get much attention at all.  Yet both types of costs are equal in the place where it really counts: how the company’s cash balance changes from quarter to quarter.

The work I did for OceanaGold led me to wonder what the same sort of analysis would look like for other gold companies.  What are the total costs of mining on a quarterly basis and how do they differ from the reported (expensed) cash costs that get so much attention from the brokerage community?  What we are really interested in with any company is how much free cash they can generate.  If a company is generating a lot of operating cash but is plowing that cash right back into the mine as sustaining capital, well then they are running on the spot.  So total costs is what matters, be they lumpier and messier than cash costs or not.

Moreover I have to imagine that there is grey area when applying the criteria of what constitutes an expensed cost and what constitutes a capitalized cost.  The implementation whatever accounting methodology is used probably varies from company to company.  Simply looking at cash costs might ignore these discrepancies and paint a poor picture of what’s really going on in the operations.

To look at the effect of overall costs, what I have done is simply this.  I took the cash costs stated by each company for the last two quarters and added to those costs the additions to property, plant and equipment as reported on their cashflow statement.  Then I divided summation of these two costs by the ounces produced over the first two quarters.  Because PP&A is likely to be more variable, it might be worthwhile to do this over a longer time horizon, but for now this will have to suffice.


  This is an interesting result.  It is particularly interesting when you compare the list against the same list of companies sorted on the more traditional cast costs metric.

What you see is that the companies that are lowest on the cash cost scale are not necessarily the lowest on the total costs scale.

Now of course, like everything, these results have to be taken with a grain of salt.  One of the reasons that capitalized costs are not added to cash costs in for traditional analysis is because they are inherently lumpy.  One time purchases that should be capitalized could skew the picture of the quarterly performance of a company.  Brigus Gold is a good example of this.  They are ramping up their underground mine at Black Fox right now.  There are a lot of capitalized costs associated with that ramp up.

I went another step further by looking at costs for the full year 2010.  That graph is shown below.  Here a few of the companies (Lake Shore, Atna, Alacer, etc) drop off the list because they didn’t have comparable production for the period for one reason or another.

To make a few observations from the above graphs, the first being that OceanaGold does not look like such a high cost producer.  While their cash costs are higher than the norm, their capitalized costs have consistently been lower than normal.  I wonder how much this is caused by having a mature mine.

Another observation I would make is that Aurizon Mines truly is a (if not the) low cost producer.  Both OceanaGold and Aurizon Mine are cash generators, which should serve them well over the longer term as they develop their mines.

A final observation is that B2Gold is worth taking a closer look at.

Gold Stocks: Am I Wrong?

Last week was playing out just dandy until about 7:30 am on thursday.  That’s when the stock market opened and the gold stocks I owned fell along with the rest of the market.

Since the peak on Wednesday afternoon Jaguar Mining is down $1.10, or 16.4%.  OceanaGold is down 0.65, or 23%.  Argonaut Gold is down 14%.  Lydian International is also down 14%.

Now I could write a post about how unjustified this is.  How these 4 stocks, and gold stocks in general, never began to price in a gold price of $1500/oz, let alone $1800/oz.  And about how in the case of OceanaGold and Jaguar Mining, the stock price is significantly lower then it was when the gold price was $1000/oz.

All of this is true, but its not necessarily helpful going forward.  What is helpful is to assess the situation and determine if I am best to stick it out, or admit that maybe I am wrong about the direction of gold stocks.

I’ve spent most of the weekend pondering the reasons for gold stocks to go up and the reasons for gold stocks to go down.

I think that the basis of all the arguments for and against come down to the causation of the rise in the price of gold.  Now maybe I am simplifying the situation too much, but think you can narrow it down to two contrasting views of why gold is going up.  Each view leads to a drastically different opinion of what will happen to the price of gold (and the price of gold stocks) going forward.

These views are:

  1. Gold has gone up on the expectation of Federal Reserve balance sheet expansion
  2. Gold has gone up on fear of the disintegration of the Euro and the EU

The first argument is what is being bandied about the most over the weekend.  Gold, and thus gold mining stocks, were pricing in QE3 and that didn’t happen.  Operation twist is not quantitative easing.  There is no expansion of the Federal Reserve balance sheet and there is none on the immediate horizon.  So if the price of gold is a function of the Federal Reserve balance sheet, then gold must return to pre-QE3-anticipation levels.  A good starting point would be $1400-$1500/oz.  Or perhaps gold goes lower if it overshoots to the downside or if the Fed begins to gain credibility in its balance sheet management.

The second view was invoked quite often over the last month, but it seems to have fallen on deaf ears in the last couple of days.  That’s because it doesn’t fit the evidence.  the EU is still a mess.  The price of gold is falling precipitously.

So does the move of the last two days mean that the Fed watchers are right and that the run in gold is over until there is at least some evidence of QE3 on the horizon?  I’m not willing to say that yet.  I’m going to re-quote what I paraphrased from Donald Coxe a couple days ago:

The investment case for gold lies in the 500 million people living within 17 different countries that have their savings, pay cheques, and pensions tied to a currency that was based on a theory and seems by the day to have less of a tie to reality.

This argument still holds a lot of water in my mind.  There is still no good way to resolve the situation in Europe.  As long as this is the case, gold should continue to have a bid.  And I can’t see how this will stop being the case.  There simply isn’t the money available to resolve the debt issues of the PIIGS.  The only solution seems to be the extradition of at least some of the PIIGS from the EU.  That is going to be such a messy process, with so many potential pitfalls for both the sovereigns and the banks, that I can’t see how gold would fall in such an environment.

But I remain open to the possibility that I am wrong.  I will be watching the price of gold over the next few days and if the weakness continues I will have no choice but to cut my positions.  In that regard, I will likely lighten up on OceanaGold first.  Both Jaguar Mining and Argonaut Gold are in somewhat envious positions right now.  Jaguars mines are in Brazil, while Argonaut Gold has its mines in Mexico.  Both the Real and the Peso have been falling lately.  This will help bring down Q3 costs and even more bring down Q4 costs.

OceanaGold operates in New Zealand, and while the currency there has began to weaken, it is still above the average levels of Q2.

Lydian I will continue to hold because the story there is really less attached to the price of gold then in the other cases.  Lydian is moving forward an exploration project that will be profitable at much lower gold prices.  At some point the company will be taken out.  So that one I will hold as well.

We’ll just have to see how this next week plays out.

Oceanagold: Don’t Confuse the Headline with Cash flow

Over the last few weeks I have bought back a reasonably sized position of OceanaGold. This after having been out of the stock since the day of their Q2 update. When the Q2 update came out I took one look at the cash cost number ($900+) and one look at the production number (60,000 oz) and figured it was best to run to the sidelines and wait for the inevitable shakedown to pass.

That turned out to be a good decision.

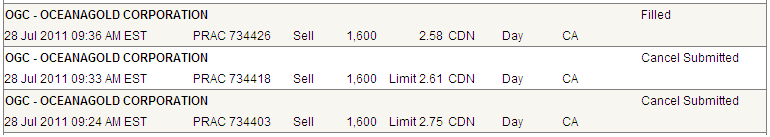
When I read bad news, I have found it is usually better to sell first than it is to wait for the reaction to play out.  It is better to “panic”.   Why you would buy and hold a stock that you know is sure to go down, even if it is only in the short run?  In OceanaGold’s case, it was clear that at $2.70 or even $2.50, the share price was too high given the severity of the quarter.  The stock had traded to $2.20 only weeks before news of the quarter came out.  Certainly one could expect it to trade to at least $2.20 once such news was public.

And it did. The stocks traded all the way down to $1.80 in fact. I was glad that I had “panicked” on the morning of the press release and gotten out at $2.58.

But one has to be careful not to confuse the reaction with the facts. The initial market reaction can be based on the inefficiencies of investors/speculators who do not read past the headline, do not know what they own, or are selling on technicals. The trick, I think, is to understand enough to both know how bad the bad news will be taken, as well as how bad the news actually is.

In OceanaGold’s case, the perception was clearly going to be a short term drag on the stock. The headline numbers were awful and that is what is most important to most investors. Equally important though, was the knowledge that the details of the quarter were not quite as disasterous as they appeared at a glance.

The majority of the miss from the quarter can be attributed to three reasons. First, the New Zealand dollar appreciated far further than I think anyone has expected. Second, the mine plan is causing the company to expense more costs. Third, they lost some of their underground workforce.

There is, of course, nothing OceanaGold can do about the New Zealand dollar.

However the latter two problems are worth expanding on.

The issue with mining costs took place at Macraes open pit. The problem, as the company explained it, had to do with a change to the mine plan and the effect it had on the accounting treatment of strip mining. When the company is pre-stripping a new orezone, the company can capitalize that strip. It will show up some time later as depreciation on the balance sheet. However once the company reaches a new orezone, all strip needs to be expensed as it is incurred.

What happened in the second quarter is that there was far less pre-strip incurred then has been the case in previous quarters. And so most of the costs of mining were expensed directly on the income statement as opposed to having some of those costs expensed.

More specifically, the original mine plan had the Company mining an area (stage 4) of the open pit that, after drilling, was determined to be uneconomic.   Some of the mining fleet was supposed to be utilized prestripping stage 4 but because the area was determined uneconomic the fleet was used instead for waste mining of stage 5.  Because the ore from stage 5 is already accessible, this waste mining could not be capitalized and had to be expensed.

As an aside, it’s interesting to note here how this scenario demonstrates how cash costs are not really cash costs. Cash costs are actually the expensed portion of costs for that particular period. Depending on the accounting treatment, a company could spend much more cash in a quarter than what gets attributed to cash costs.

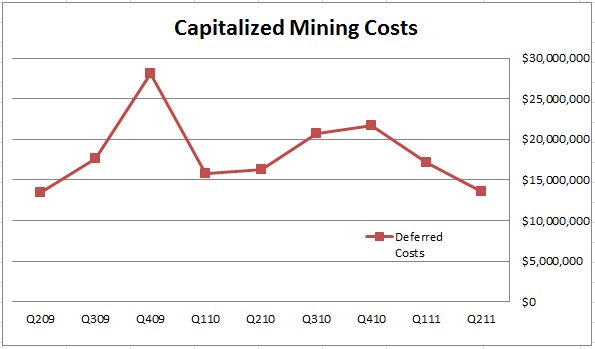
In the case of OceanaGold, the best way to see this effect is to look at the total cash outflow that OceanaGold has been spending on producing its mines over the past few years. This cash outflow includes both expensed production costs (the costs on the income statement) and capitalized production costs (the pre-stripping that only shows up on the cashflow statement). This is shown in the chart below.  Now unfortunately you can’t just look at Macraes alone.  The cashflow statement gives the combined capitalized costs of all operations.  But still, you get the basic idea of how costs were higher in Q2, but not as much higher as the cash costs would suggest.

The key point to be made by the graph is that while cash costs per ounce increased a whopping 25% quarter over quarter, total mining costs, as shown in the graph, increased 6%.

To get an idea of just how much money was deferred in the second quarter, when compared to previous quarters, the following chart plots total capitalized production costs on a quarterly basis. You can see how relatively little was capitalized in the recent quarter.

So really, from a cost of mining perspective, OceanaGold did not have nearly as bad of a quarter as the headline appears.  Make no mistake, it also wasn’t a great quarter, but it wasn’t nearly as bad as the headline.

At Reefton, management said the problems are entirely attributable to workforce turnover. They had a bunch of their miners quit, and the new miners weren’t as efficient. So they had to mill low grade stockpiles. You can see the low grade milling in Q2 versus previous quarters below.

What is somewhat puzzling about the reason given is that when you looking at the mining output at Reefton over the last few quarters, it really doesn’t suggest that severe of a deficiency in ore.  And from the figure above, mined grade for the quarter was actually quite a bit higher than milled grade (~1.8 g/t versus ~1.4 g/t).

I’m not really sure what to make of this.  Either A. they’re lying about what the problems are, or B. the problems were more temporary than the company is letting on and recovered even during the quarter (they said Reefton wouldn’t fully recover until Q4)

I think the more likely explanation is  that they are quietly hedging their future expectations.

Management also said they are bringing on-line the smaller Souvenir deposit at Reefton. This is somewhat interesting. Souvenir is a fairly narrow, almost vertical vein that hosts about 10,000 oz of reserves and another 30,000 oz of resource. The grade is somewhere between 3g/t and 4g/t; based on drill results it is probably closer to 4g/t but because there is sparse drilling at Souvenir the auditors decided to err cautiously.

Souvenir should help make a dent in cash costs at Reefton by bringing up the overall grade through the mill. But given the small size of the deposit, this is not really a long term solution to the labour force issues. Those need to be (and hopefully are being) addressed.

Valuation

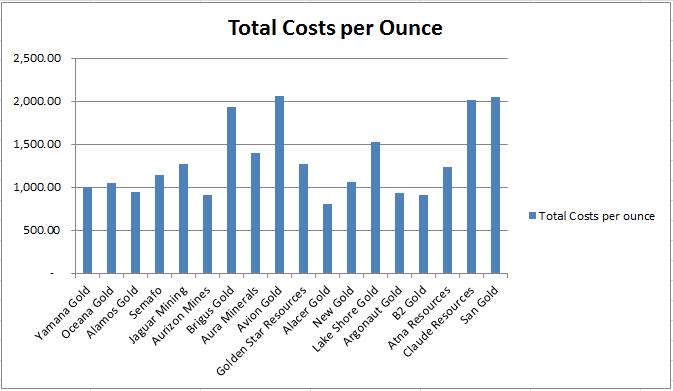
The thing about OceanaGold is that they are just so cheap compared to their peers. Therefore, if you can’t discount the company’s value because of major operational issues (which I have tried to show is not the case) then there is just no reason for it to be trading as cheaply as it is.

BMO wrote a great report on the gold miners a week ago.  OceanaGold was included in the comparisons.  Below I have cut and paste a couple valuation metrics that BMO used in a recent report on precious metal miners. These comparisons show clearly just how undervalued OGC is relative to its peers.

The company trades on metrics that are only comparable to low caliber junior miners and larger miners with high cost operations that cannot generate cash flow. Heck, there are some miners that haven’t consistently generated cash flow that trade at a premium to OceanaGold. Its ridiculous.  OceanaGold has consistently been generating between $30M and $40M of operating cash flow.  They should be able to bring on their next project Didipio, without having to raise any money and while maintaining a decent cash balance.

As I’ve tried to point out above, while the company has had some operational issues, these are by no means debilitating. Moreover, the company has a strong growth profile, with Didipio expecting to add to gold production at low costs (because of copper by-product credits) in a little over a year. The company should, if anything, be trading as a growth story, not at the tremendous discount that it is given.

So I bought a position. We’ll see how it goes.