Skip to content

Equal Energy: Is the Lochend Cardium Starting to Show Promise?

I haven’t talked much about my investment in Equal Energy yet.  The reason is probably a combination of factors.  First, I haven’t been happy with the stock performance.  Second, it seems that every time I try to sit down and write something substantial about a company, Europe implodes a  bit further and I get distracted.

Equal Energy has been the most disappointing of my recent  oil and gas investments.  In retrospect the mistake I made was in jumping on a story that hadn’t begun to be told yet.  Whereas Coastal Energy and Arcan are in the process of delineating their resource (and thus unfolding their story), Equal is not.

The Equal Energy story lies in its yet to be drilled Mississippian lands in Alfalfa, Grant and Garfield county.

But when Equal will drill a well into the Mississippian I do not know.  Management threw out a bone along with the Q2 MD&A when they said they “expect to test the Mississippian zone during the second half of
2011.”.  But it could be a while before we actually see a horizontal well drilled.

I do not begrudge the company for moving cautiously on the Mississippian.  Why not wait and let completion techniques get refined, well control in surrounding sections be further understood.

There is much to be gained from waiting and letting other companies do the early trial-and-error work.

But its not that much fun for an investor holding a languishing stock.

Apart from the Mississippian, Equal has 3 other plays that have the opportunity to provide short term upside:

  1. Gas-condensate from the Hunton in Oklahoma
  2. Oil from Viking in eastern Alberta and western Saskatchewan
  3. Oil from Cardium at lochend just west and northwest of Calgary

It is the Lochend I want to talk about here.

What about Lochend?

The Lochend play has always been the least interesting play of the bunch to me.

So why take the time to post on the subject?  Well first of all, we need to understand all aspects of our investments; even those that may not be the crown jewel.  Second, the technology of horizontal drilling is evolving, and so what might have been marginal in the past may be prospective in the future.

Marginal is good term to describe Lochend’s past.  The economics of the Lochend have always seemed to be a weak sister to Garrington.  There is much skepticism about its productivity, particularly whether rates can hold up over the long run.  The net pay at Lochend is thinner than at Garrington.  And while the overall Cardium zone is in the neighbourhood of 8-20m, only a portion of the pay is really prospective with recoverable oil.   Unlike Garrington, the oil is generally thought to be only accessible from the Cardium “A” sands, with the “B” sands being too thin and too scattered to be productive.

Not helping matters is that all-in drilling, completing and tie-in costs are in the $3.5M to $4M range.

Equal has about 11 sections in the Lochend area, so its not a particularly large position for the company.  But its not inconsequential either.  To make a back of the napkin calculation, taking Equal’s 11.5 sections risked at 50%, assuming 4 wells per section and using Equal’s NPV10 per well of $2.3M, gives a risked NAV to the company of a little over $50M.  A little over $1.50 a share. Not inconsequential but no home run potential.

The question that has always hung over Lochend has been whether that NAV is actually realizable.

There have been a number of data points lately that help answer that question.

Recent Drilling at Lochend

I got interested in taking a closer look at Lochend after reading the quarterly update from NAL.  In it, NAL provided an update on their Lochend results, and it was a much more upbeat assessment than any the company had previously provided.

NAL highlighted one well in particular, the 3-17 well, and said they would be focusing on the land around that well.

The 2011 program at Lochend is focused around the 3-17-27-3W5M well from the 2010 program. The 3-17 well has now been on production for 12 months and is currently producing at a rate of approximately 200 boe per day, exceeding NAL’s Garrington type curve.

Its worthwhile to point out here that 03-17 is basically surrounded by Equal’s land.  Below I colored the 03-17 well in a blue star, while Equal’s land are in yellow.

This has gotten some of the brokerages interested.  Scotia had the following to say about the results.

We view the results to date at Lochend positively and with intrigue. The company has also signalled its interest with participation in a gas gathering line initiative in the area to enable future gas conservation, along with construction of its own solution gas handling facility with 2,500 boe/d of oil and 7 mmcf/d of solution gas throughput capacity. The update also notes the oil battery is expected to be operational by year-end, which should enhance operational efficiencies as the area continues to emerge. We note that our valuation of the area could have positive implications as the play continues to be de-risked.

My interest piqued, I did a bit of searching to see what other company’s operating at Lochend had been saying.

As it turns out, Tamarack Valley has also drilled a couple of Lochend wells recently.  In an August 11th press release the company provided a table of the IP15 for the two wells drilled recently.

Tamarack Valley also  provided some more detailed information on the play in their recent presentation (slides 11-12).

Trioil has also recently had some above expectation IP30’s.  From their August 24th press release:

The well flowed at strong rates over its initial 14 days and continued to produce steadily once it was equipped. The well averaged 323 boe/d (86% light oil) over its initial 28 days of production. With the release of our most recent completion results, our four slick water completions to date have an average IP30 rate of over 200 boe/d, which is above our budgeted volumes.

Perhaps because they have essentially all their eggs in the Lochend basket, Trioil has been quite candid (promotional?) about Lochend in their company presentations.  They posted the following profile comparison of all wells drilled at Lochend to date.

The important thing to focus on here are the 4 over-sized red curves.  These represent 4 recently completed wells using oil (slickwater) fracs rather than water fracs.  The point being made by the graph, and which was also made by both NAL and Trioil in their commentary on their Lochend results, is that the move to oil-based fracs has improved the economics of the play.

I decided to take a look and see if this was right.

Just how good (or bad) are the Lochend results?

Below I graphed all the wells from Lochend (pretty much just like Trioil did).

Note that in the interest of time I just looked at the oil production.  I didn’t want to spend the time to do the calculations on gas conversion needed to define a boe number for each well.  Thus, when comparing the results to the type curve, keep in mind that the type curve does include associated gas, and so its somewhat higher.

In the following chart, I have color coded the production based on IP date.  The purpose of the graph is to see if there is a positive trend in productivity.  Wells that IP’d in Q2 and thereafter are in red.  Wells that IP’d before Q2 are in green.

There does appear to be a significant improvement in results that has occured of late.

The same information can be gleaned by looking directly at the average IP30 and IP60 for Lochend wells.

Clearly the move to the slick-water frac jobs has made a difference, at least to the early time performance of the well.

However, we have to be careful not to take this extrapolation too far.  The reservoir is still the same as it was and that is, in the long run, what is going to dictate performance.  At this point we have to limit our conclusion to the direct one: the slick water frac is producing higher early time production than the water based fracs that were employed previously.

It is tempting to extrapolate to the entire decline profile and shift the whole curve up. This may turn out to be valid, but I would be hesitant to make that extrapolation yet.  2 months production does not make a well.  Moreover, the driving physics behind the first couple months of production is often quite different than what drives production later on.  Only the near wellbore reservoir has been accessed, the results say little about how connected (permeable) the reservoir is in its extents.  And it is that which will determine the performance over the next few years, and that’s what matters to the economics.

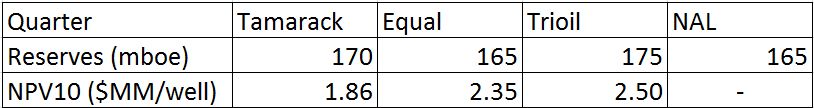
The second point that must be made that also tempers our enthusiasm is that even with these improvements, the economics of Lochend are still not tremendous.  With the move to slick water it looks like the results are moving towards a moderate out-performance of the type curve.  But the type curves showed only passable economics to begin with.  Below are the NPV10 estimates from most of the companies in the region (note: PBN and BNP are too big and don’t breakout Lochend from their other Cardium plays and NAL doesn’t provide an NPV10 estimate).


The net result is some interesting progress worth following.  But nothing yet that indicates a game changer.

So where are these high IP wells being drilled?

The next thing I thought it would be interesting to look at is whether there is a “sweet spot” at Lochend.  Below I have highlighted in yellow any section that has had a well with an IP greater than 150bbl/d.  Again I am only looking at oil production here.

Not much of a pattern.  The high productivity wells are scattered across the NW trend that goes from Township 26 to Township 28.

What’s Equal been doing at Lochend?

Equal’s lands are well situated with the trend.  In the map below I have highlighted the sections owned by Equal with a dark black.  You can see how they are mostly within the “heart” of the play.   Also note Equals land surronding the 03-17 well, as mentioned previously.  Equal has a number of locations defined in those sections.

Overall, Equal hasn’t seen results from Lochend that are as good as have been experienced by others, as shown in the chart below.  They are so far mostly below the type curve provided by the company in their recent June presentation.  But keep in mind most of these wells were drilled last year, and so most likely weren’t done using the slick-water frac.

The one well that was drilled in Q2 did produce reasonably well.  This was the 16-04 well.  The 16-04 produced at a calendar rate of 203bbl/d (again that is oil; I’m not including associated reservoir gas in my estimate) for the first month, followed by a rate of 112.7bbl/d in the second month.

It all boils down to Economics

So what does this all suggest for Lochend economics, and for Equal in particular.  I would draw the following conclusions:

  1. The slick water frac appears to be producing results above the expected Lochend type curve.  But the Lochend type curve is not a terribly robust one ($2.3M NPV on a $4M CAPEX well is not great economics).
  2. Equal has land that is in the heart of the play and so one could expect similar average results from Equal’s land as what Trioil, NAL and Tamarack are seeing
  3. Even with the slickwater improvement, the combination of the still luke-warm economics and the uncertainty about whether the new slick-water wells will continue to perform as well as they have thus far means the play is far from being “de-risked”

I think Equal is doing the right thing with their upcoming drill program.  They are planning only 1 well in the second half of 2011.  Let’s get some more datapoints out there and let’s see if there can be further production improvements.  Equal can drill up its sections once the uncertainty has passed.

More on why you need to Consider the Position of French Banks to Buy Canadian Oil Stocks

Just a quick note before I head off for the day.  The following was reported in the WSJ this morning.

“We can no longer borrow dollars. U.S. money-market funds are not lending to us anymore,” a bank executive for BNP Paribas, who declines to be named, told me last week. “Since we don’t have access to dollars anymore, we’re creating a market in euros. This is a first. . . . we hope it will work, otherwise the downward spiral will be hell. We will no longer be trusted at all and no one will lend to us anymore.”

The full article is available here for subscribers.  For non-subscribers, FT published some thoughts here.

I’m surprised that so far the market is taking this in stride.

The article goes on to explain the source of the concern.

BNP, Société Générale and Crédit Agricole together hold nearly $57 billion in Greek sovereign and private debt, versus $34 billion held by the largest German banks and $14 billion at British banks. And then there is Spain and Italy. French banks held more than €140 billion in total Spanish debt and almost €400 billion in Italian debt as of December, according to the latest figures from the Bank for International Settlements. If either of these governments were to default on their debts, their banking systems could collapse and take the French system along with them. BNP, Société Générale and Credit Agricole all say that their finances are in order and the market worries are unfounded.

In the event of a Greek default the French will need to bailout their banks just as the Germans will need to bail out theirs.

The problem is that the French banks are so large compared to French GDP.  This is the question FT asks.

Now, let’s say the French government is forced to recapitalise its banking sector. What would that mean for its AAA rating?

It would not be good for it.

The situation in Europe is evolving and not in a good way.  I think that the market opening up today presents another good opportunity to reduce risk.

Week 10: Back above Par

While the markets continue to shake and shudder, my 10 week old tracking portfolio put in a yeoman performance last week, bucking the trend and returning to the black.  In the period since my portfolios inception (July 1st, 2011)  the TSX is down 7.1% and the S&P is down 13.8%.  So on a relative performance basis I am doing ok.  I would like to be able to make money again some day though.  Of course, that is difficult when it seems that the best place to put your money is in cash.

I made one trade last week.  I bought Collosus Minerals.  Its hard not to be enticed by the momentum of the gold stocks.  In my actual portfolio I did more tweaking by reducing my positions a bit further in Arcan and Equal.  As I have said before I will not tweak in this practice portfolio because the commissions are too high.  In my actual accounts I also increased my banking hedge by adding to shorts of Bank of America and UBS.

In a related note, Don Coxe had an excellent conference call this week.  He is finally beginning to see Europe as negatively as I am.  He is also still a strong believer in gold.  Its worth a listen.

My Attempt to Understand Gramercy’s CDO-2006

Gramercy Capital finished up on the week while the rest of the market slumped.  The reason is the continuing recognition by the Street that the company’s settlement of Realty opens the door of potential.

What the news of the settlment does is it allows investors to begin to evaluate the company based on what is left without having to wonder what they might eventually have to subtract.  And what is left is a company with a lot of cash, a number of commercial real estate holdings on their balance sheet, a management fee that more than covers Realty expenses, and the equity level stakes in 3 CDO’s filled with primarily commercial real estate securities, 2 of which are paying back significant sums of cash.

Let’s Go Back to the Beginning

I came across Gramercy by way of a few degrees of separation.    I actually happened on the analysis from another site, Above Average Odds (AAO).    I had originally discovered AAO when I was scouring the net researching Equal Energy.  Above Average Odds agreed with me that Equal Energy was undervalued, and just as importantly they recognized the value in the up-and-coming Mississippian play that the market was (and is continuing) to ignore.   Their work, in particular their early understanding of the potential of the Mississippian, impressed me enough to continue to follow the site.

Well as it turns out Equal has been the poorest of my oil and gas stocks (I should really know better than to invest in debt laden juniors), though the value is still there.  But that’s another story… the point here is that the Equal Energy story led me to a future post from AAO on Gramercy Capital. This post was not written by AAO but my another blogger, PlanMaestro, who writes his own blog called Variant Perceptions.  When I initially bought Gramercy, I did so on the basis of the analysis written up by PlanMaestro.

At the time I did some leg work of my own to wrap my head around the story.  I read through the 10-K (which was actually the 2009 10-K) and sifted through posts on yahoo and investors hub.  It was clear to me that the stock was cheap, that the risks were not as high as perceived, and that was enough for me to buy a piece in the company.

But I didn’t really delve as deeply as I do with most of my investments.  I think the reason was that the inner workings of a CDO seemed quite opaque to me, and so I found it kind of intimidating to jump into that pool.  This weekend I decided to get a better grasp of the CDO and in particular Gramercy’s CDO’s.  On Friday night I printed out the information that was available (a set of the March 2011 managers reports for CDO-2005 and CDO-2006 that someone was so kind to post on googledocs), waited until everyone had fallen asleep, and sat down with a drink and an open ended time frame that I wasn’t going to bed until I understood how these things worked.

It actually didn’t take too long.

In retrospect, I regret not having done a more thorough analysis sooner.  It prevented me from recognizing just how much potential this stock has.  And while I own a good chunk of the stock right now, I would have undoubtably bought more if I had spent the time to actually understand the CDO’s sooner.

So what did I learn?

The first thing I learned is that CDO’s are not as complicated as their reputation makes them out to be.  And Gramercy’s CDO’s are even less complicated then most.  As with most seemingly inaccessible subjects,  the opaqueness of a CDO revolves around the inaccessibility of the language (mostly acronyms) used.  To put it simply, there are a bunch of indsutry lingo used and who the heck knows what they mean.  But once you know those definitions you realize the concepts are actually quite straightforward.

Before I talk about the Gramercy CDO’s in particular, I’m going to point to a few basic primers on what a CDO is and how it works.

First, this video and this video are both great.

Ok, so lets look at Gramercy’s CDO’s.  I’m going to focus here in this post on CDO-2006.  CDO-2005 and CDO-2006 are, the sense of structure, the same.  If you understand how the one works you understand the other.  Same structure, with each one comprised of different loans and securities.  Now there are a few impotant differences between the two in terms of performance, but I will discuss that more at the end.

Onto GKK CDO-2006!

So when Gramercy created CDO-2006, they got together $1B of investment capital, put it into what is called a special purpose vehicle (which is just a fancy name for what effectively amounts to a holding company), and bought $1B worth of commercial mortgage securities.

The $1B of investment capital was obtained by the selling of notes that were divided up into classes (or tranches) based on the seniority of who would be paid back first.  The tranches created and the amount of notes in each tranche were:

The highest tranche (1A A-1) gets paid back first.  But the highest tranche also receives the lowest return.

And here we get to the first interesting point about CDO-2006.  The interest paid to the notes.  To put it plainly, the interest being paid to these notes is a steal.  Below I have snipped the interest being paid on each tranche of notes for the March quarter.

All of these notes are tied to 3 month LIBOR.  If you look at the largest (and highest rated) tranches, their spread to LIBOR is small.  Thus, with LIBOR rates non-existent right now, the interest paid for the capital is equally small.  I’m sure that in 2006 when the world was rocking these notes seemed like a reasonable investment, but right now they seem like very low returns for the risk of investing in US commercial real estate.

Which is all the better for Gramercy.

What about going forward?  Well, who am I to predict the future, but one thing that does make it easier to predict is when you are told what it is going to be.  The Fed said they are keeping rates look for 2 years.   There’s little to think that the economy could accelerate so quickly as to put the Fed’s word in doubt.  I think its safe to say that’s Gramercy’s extremely low cost debt funding train is going to continue.

Below is what 3 month LIBOR has done over the last year.

Looking at the first quarter report, the CDO paid out $1.5M in interest to the tranches not held by Gramercy.  That means that they are paying an annualized $6M interest in return for the access to $900M of capital.

When you think about what’s really going on here you have to admit its a little crazy.  Compare what Gramercy is getting capital for to your typical high yield industrial company (think Tembec and their issue of longer term debt at 9+%).  Gramercy is getting a tremendous deal here.   And its all non-recourse.

In CDO-2006 Gramercy owns the J and K notes, as well as the preferred.  These would be considered to be the equity level tranches.  The J and K notes pay higher interest than the senior tranches at about 3.5% and 7%, but it is the preferred that is the real money maker.  The preferred keeps all the excess interest beyond what needs to be paid to the more senior notes.  When you are investing $1B in real estate and pay out less than 1% for that capital, there tends to be a lot of excess interest.

Below are the interest payments to the J, K and preferred for the March quarter:

The CDO paid out $7.6M in the quarter to Gramercy in the first quarter.  About $30M annually.

One thing that is worth pointing out is that the CDO delivered these returns while holding $158M of its assets in cash.  For the sake of interest, lets just do a back of the napkin calculation of how much more interest the company could generate if they put that cash to work at similar interest rates to the assets they already have.

Total interest distribution was $9.1M on total performing CDO assets of $881M.  So interest was an annualized 4.1% of assets.  The $158M of cash at 4.1% would generate another $6.5M per quarter.  All this would go straight to the preferred.  So potentially, the 2006 CDO has the opportunity to almost double its return to Gramercy.

Moreoever, my understanding is that a lot of CRE loans are closer to the 6% range.  So a 4.1% assumption is likely quite conservative.

At any rate there is the potential to make a lot of money from CDO 2006.

There is however, a limited amount of time forthe cash to be invested.  Both CDO-2005 and CDO-2006 are structured such that there is a window in which new cash (from principle payments) can be put towards new investments.  After this period ends, once a loan is paid back the proceeds need to be used to pay back the note holders, starting with the most senior first.  For CDO-2005 that time has passed.  For CDO-2006 that has passed as well, but it passed in July of this year.  So we don’t know yet what investments Gramercy has made with the cash.  Hopefully its something that pays good interest.

The other stipulation on both CDO-2005 and CDO-2006 is that they both must pass a number of tests before money can be passed on to the equity tranches.   The CDO has to pass what is called an overcollateralization test and an interest coverage test.

Both of these tests are straightforward and are exactly what their names suggest.  In the case of the overcollateralization test all of the assets currently held by the CDO are added up, any delinquent assets are given a recovery value, and that number of total assets is divided by the amount of notes that has to be repaid.  This is done for the various tranches, so for the lower tranches the upper tranches are included in the amount because they will be paid first.  Thus, the overcollateralization test for the lowest tranches (F/G/H) is the hardest to pass.

CDO-2006 passed the overcollateralization test in the March quarter.

The defaults are an interesting story in themselves.  You can see from the above tables that the defaults are being valued at a little over 25% of their whole value. Its interesting to see why this is the case.  Here is a list of the defaulted loans/securities from the same managers report:

Ok, so first of all, the 3 CDO notes from Gramercy 2007 can be ignored.  CDO-2007 is a lost cause, and so the fact that these 3 notes are being valued at about 10% is probably right.

Taking a Bit Closer Look at the Defaults

To get a sense of what these defaulted securities might be, let’s look instead at the largest default.  Fiesta da Vida.  A bit of searching turns up a court document from a couple of weeks ago that describes the current state of the loan:

Gramercy Investment Trust versus Lakemont Homes Nevada

The documentis the ruling of an appeals court to the original decision that Lakemont Homes Nevada owes Gramercy for the loan they were made by them.

The story is:

Fiesta da Vida, LLC, owned real property located in Riverside County which was to be developed by FDV Investment LLC. In order to obtain financing for the project, title to the property was transferred to FDV Investment LLC (the borrower). The borrower was an entity managed by Lakemont Homes, Inc., a California corporation. On March 30, 2007, Gramercy lent $35 million to the borrower, and the loan was secured by a deed of trust. The loan agreement provided that it would be governed by the laws of the State of New York.

But then real estate in California collapsed and Lakemont Home didn’t repay the loan.  So Gramercy went to court.

On February 3, 2010, Gramercy made a motion for summary adjudication of issues as to the second cause of action against two of the Lakemont defendants.4 On May 20, 2010, the court granted the motion. Judgment in favor of Gramercy was entitled in the amount of $33,537,994.65, plus costs. On July 22, 2010, Lakemont appealed.

The interesting ending to this saga is that the apellate court ruling on the appeal affirmed the judgement in favor of Gramercy.

So what does this all mean?  I don’t know enough to say.  While the court affirms that Gramercy should get their money back, for that to happen the money has to be there.  I did some searching for Lakemont Homes and FDV Investment LLC, who seem to be the borrowers here, and I can’t find more than a name referencing the company.

And when I look at Riverside real estate prices, it doesn’t give me the warm fuzzies about the area (these are residential prices mind you):

On the other hand, one would think that for Gramercy to spend the time in court there must be some carrot they are chasing.  We shall see.

Anyways, I digress…

What is CDO-2006 Made of?

The last thing that I want to talk about is what the CDO-2006 is actually comprised of.  Luckily, this information is all available in the managers report (note: I originally had posted a breakdown in loan data that I was told was better left un-posted.  What remains is the general aspects of the loans, which is still sufficient for drawing the conclusions I looked to draw).

The CDO contains 54 different investments as of the end of March.  Most of these are whole loans, while the rest are collateralized mortgage products.  You can see the breakdown in the table below:


A few points that I made note of as a perused the contents of CDO-2006:

  • Many of the loans are simple first lien loans against a property.
  • There are 3 Gramercy CDO-2007 notes in CDO-2006.  These were bought in 2009.  They are lower tranches (would either be mezzanine or equity) and so I think they are dead in the water.  I wonder why they bought these?
  • The three biggest whole loans on their books $48M, $45M, $42M.  So they are not overly leveraged to any particular CRE property.

One point that is worth spending some time on is just what type of CMBS and CDO’s are owned by CDO-2006.  The first thing I note is that of the CMBS and CDO’s owned, all except for the NSTAR 2006 carry interest rates of above 5%.  This is good as long as they are performing (which most of them are).  But it also implies that these are very low tranches and may not see full recovery.  So lets look for a second at what the ratings are on these notes.  I made the following table from a larger table provided in the report.  I reduced it to only include CMBS and CDO’s.


Moody’s ratings system is as follows (taken from Wikipedia):

It looks like $92M of the securities are not investment grade (includes 2 securities not rated by Moody’s but by S&P).

What does this mean for Gramercy?   The tranches of notes that Gramercy owns are the lowest, and they make up the final $96M of the total notes sold.  So to eventually recover principle on the CDO, Gramercy needs some of these non-investment grade securities to pay up.

That’s not an impossible task, particularly considering that many of the non-investment grade securities are at ratings on the cusp of investment grade (Ba1, Ba2 and Ba3).

One final piece of information about the properties owned that is relevant is where these properties are.  You can go through the list individually to determine this information, but some general location information can also be gleaned by a few of the CDO requirements tests.  CDO-2006 has some requirements about how much real estate can be owned in any particular state.  As part of the managers report there are a number of tests to see whether these requirements are met.  These tests, and the amounts owned in the central loan states, are in the table below:

So What did I Learn?

This started off as a mostly educational exercise for me.  I wanted to understand how a CDO worked and CDO-2006 was my lab rat.  And I think I achieved my goal.  I now have a much better understanding as to what a CDO is comprised of, what its liabilities are, how its interest is paid, and what how its solvency and liquidity tests are calculated.

As it more specifically applies to Gramercy, I learned the following:

  • The interest that the CDO is paying on much of the $1B in capital makes this extremely cheap money
  • The equity tranche of CDO 2006 is much more leveraged to performance than I anticipated.
  • The cash level that CDO-2006 had in March is perhaps the most important element of the CDO.  That cash could be converted into significant extra dividends to the Gramercy owned preferred once that cash is put to work
  • The eventual recovery of principle in CDO-2006 depends on the recovery of a number of CMBS and CDO securities that are not currently investment grade and so full recovery is no sure thing.

What’s Next?

the next thing I want to write-up is CDO-2005.  As I said at the start, the structure of CDO-2005 is similar to CDO-2006.  However, there are key differences in their current state.  CDO-2005 was, for quite some time, failing its overcollateralization tests.  But it was just barely failing, and there was a news release at the beginning of August that it had begun to pass again.  Now I need to spend some more time crunching the numbers on CDO-2005, but as a first pass it looks to me like the CDO should return between $5M to $6M quarterly to the holder of the preferred shares once the over-collateralization test is passed.

See the thing is, when the CDO fails its overcollateralization, all the interest to equity gets diverted to paying off principle of the senior notes until the test begins to pass again.  So Gramercy hasn’t gotten anything from CDO-2005 for quite some time.  If I’m right about my numbers (and please take them with a grain of salt at this time because i have not gone through CDO-2005 in the detail I did CDO-2006) then that is another $20M to $25M in yearly cashflow to Gramercy.  That is 40-50 cents per share, which is nothing to scoff at.

But that is yet another story.  This post was about CDO-2006 and learning about how CDO’s work.  I think I’ve said enough about that already.