I think the Market has it wrong with Jones Energy (JONE)
The most frustrating thing that has happened in the last few weeks has been to watch Jones Energy get clobbered from $18 to $14. Frustrating because I think the market has it wrong.
The drop has been precipitated by Jones cautious comments about the test of a new frac design. To recap, Jones initiated a 20 well program that increased the cluster density per frac and the amount of proppant used (which resulted in a bigger frac per stage). The program was done to evaluate whether this would increase production and EUR’s enough to justify the increased cost (about $900,000 per well). The company provided progress when they released their February 14th company update. They basically said that the evidence so far is not strong enough to justify moving to the new completion technique and that more data is required:
Of the 14 wells with 30 or more days of production, 12 have produced at or above historical type curve. Over the next two quarters, the Company will monitor production data on the test wells and undertake additional optimization techniques, prior to making a decision on whether the level of production is significant enough to justify the incremental capital investment per well, and which design to utilize going forward. In the interim, Jones Energy will be employing its traditional open-hole completion technique in the Cleveland, which is the basis for its guidance for the balance of 2014. Going forward, the Company expects its average Cleveland AFE to remain at a best-in-class $3.1 million, which we expect will allow us to continue to generate compelling rates of return in our core play.
I honestly didn’t think that the move up in the stock was simply speculation about the success of the new frac design. I thought it was a recognition that the company, which is expecting 30% production growth in 2014 and already has tremendous IRR’s in Cleveland, was simply undervalued. Apparently not.
The market is acting like a failure of the new frac design is a significant setback for the company. I think it’s time for a little perspective. As the table below, which was provided on slide 16 from the Barclays Conference presentation, notes, IRR from the Cleveland using the current frac design is 118% at $90/bbl oil and 151% at $100/bbl oil.
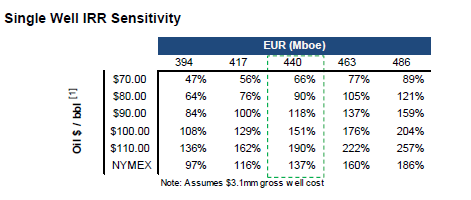
These are incredible economics. At $100 oil they rival some of the best in North America. They also represent a huge hurdle that any new completion technique has to overcome.
Its not a sure thing that the new completion technique is a failure. The company made it clear on the conference call that Cleveland’s overall production profile is not predictive from its 30 day rates. Typically 120-150 days of data is needed before the true decline and EUR can be estimated. In 2011 when the company made the move from an 11-stage frac to the current 20-stage frac, their experience was similar to now; early 30-day production results did not produce a clear of enough improvement to justify moving to the new design, but once 120 day became available the trend clearly showed incremental reserves that justified the costs and the company made the decision to use 20 stages going forward.
Thinking of this from an engineering perspective, I get the impression that the Cleveland, which is not a true shale, is more naturally fractured and higher permeability than your typical shale play. Therefore I would suspect that the more muted early-time response is simply a consequence of the near-wellbore reservoir already doing a pretty good job draining itself on its own. The upside kick may very well occur as more reservoir is accessed from the larger frac job.
Its conjecture of course and we will just have to wait and see, but I wouldn’t be surprised if the market turns out to be premature in its dismissal of the results. I also wouldn’t be surprised if regardless of how the new completion design turns out, Jones meets its production guidance for 2014 and the stock trades up to $20 by year end.
I was very impressed by the disclosure and content provided by the company in the conference call. Jonny Jones is an impressive sounding CEO who sounds like he has a firm grasp on the technical side, which is refreshing. The guidance about the future prospects in the Tonkawa and other horizons was encouraging. Jones holds a stacked play on its acreage with multiple potentials beyond just the Cleveland and the Woodford. The company noted that they are having only limited success in acquiring acreage because private equity is outbidding them at prices above both what they are will to pay and what the market is currently valuing Jones at. So private equity, which is typically quite focused on cash flow, sees value here.
None of this is reflected in the current share price. I added to my position on Friday at a little under $14.


IRRs above 30% are probably too good to be true. Shale companies have largely been losing money in the past few years. Rex Tillerson of Exxon has said that “we are losing our shirts”.
Historically, it has been very difficult to make money in oil and gas. Independent oil and gas companies have not generated a lot of wealth due to all of the fraud out there. A lot of them say that they will make easy money and then fail to live up to their promises.
Link to the comment by Tillerson?
http://webcache.googleusercontent.com/search?q=cache:vTGb8lPgEhgJ:online.wsj.com/news/articles/SB10001424052702303561504577492501026260464+&cd=1&hl=en&ct=clnk&gl=ca&client=firefox-a
Thanks for the link. Things look better at $4.50 NYMEX
I am confused about the capital structure for JONE. There seem to be 12.5 million class A shares that trade on the NYSE. But there are also 36.8 million class B shares that apparently do not trade publicly. The JONE web site says the market cap is $177 million (12.5 x $14.14), but it also says that there are 49.3 million shares outstanding. Their Q4 earnings release says the number of basic and diluted shares is 12.5 million, but it also talks about controlling and non-controlling interests. Are the class B shares the non-controlling interests? Who owns them and what are their claims on the company? How should one think about all of this? Thanks for your help. (By the way, did you publish a write-up on JONE? If so, I cannot find it.)
Okay, slide 30 of the Barclays presentation explains it. There are effectively 49.3 million shares outstanding. All have equal voting and economic interests. Management and other insiders own the B’s. The B’s don’t trade but will/can be converted to A’s under appropriate circumstances. It was set up this way for tax reasons.
BTW, I agree that those IRR’s look terrific.
Best illustration of the share structure is on page 10 of the prospectus: http://www.sec.gov/Archives/edgar/data/1573166/000104746913007748/a2216042z424b4.htm

Here it is:
I wrote about Jones once before. https://reminiscencesofastockblogger.com/2013/12/10/week-127-a-couple-of-new-stocks-and-getting-rid-of-a-few-others-jone-mhr-pxl-ca-dgit-trox/
I was trying to get my arms around the capital structure so that I could calculate the enterprise value and compare it to their PV-10 of $1 billion. I think I now understand the share count, but I have another problem–how much net debt should I add to the market cap to get the EV. The 4Q press release says:
“…the Company had borrowings of $498.0 million outstanding under its revolving credit facility,..and had $23.8 million of cash and cash equivalents…”
So, the EV is (49.3 x $14.14) + $498 – $24 = $1.17 billion, right? Not so fast. If I drop down to the balance sheet, it says that long term debt is $658 million. Why the difference? And since current liabilities exceed current assets by $50 million, it does not seem prudent to give the company credit for having $24 million in ‘excess’ cash. Maybe the EV should be calculated as (49.3 x $14.14) + 658 + 50 = $1.4 billion.
Bottom line is that I am still having trouble valuing this company. I welcome your thoughts.
$658mm is right for debt but if you are going to use that number you need to realize Q4 results don’t reflect the $195mm capital they spent on Sabine acquisition. Q3 debt was $438mm.
Sabine acquisition closed Dec 18th so Q4 numbers do not reflect its impact
Sabine PR: http://www.sec.gov/Archives/edgar/data/1573166/000110465913086920/a13-25065_1ex99d1.htm
The Proved reserves from the Sabine acquisition are already included in the Q4 results, since the acquisition closed before on 12/18. So the relevant debt is indeed 658M$. JONE EV as of 12/31 is the PV-10 if it’s reserves.
FWIW, the high IRR mentioned in the press releases should be taken with a grain of salt. I think they are just measured against the drilling costs, but do not take into account the cost to acquire acreage and prepare the property for drilling (seismic) etc.
That’s true, but as I said the Q4 numbers, by which I meant the production results and EBITDAX for the fourth quarter. These will not be reflective of a quarter of production from the Sabine assets. I’m not sure what to say about PV-10. It never seems to indicate whether or not a stock will do well in my experience.
I don’t know if its full cycle or half cycle IRRs. But do you really think that if they included the cost of their land it would impact the IRR significantly? They have been drilling Cleveland wells a long time. Do you know that they paid significantly for that acreage?
Just more generally, I have to admit I don’t really understand the argument when I hear about full cycle economics being applied to a company that already has a significant acreage position. I remember the same thing being said about some Bakken players a few years ago, and I just kept thinking, if you already own the acres and purchased them before the boom, why is the full cycle IRR based on current acreage prices even relevant? If anything lower full cycle IRRs are indicative of unrealized value of the land position you already own.
If the Cleveland land position is indeed stacked pay, that changes the full cycle IRR yet again.
Acreage acquisition costs: I guess it depends on your time horizon. Longer term, the company will want to replace drilled locations with new ones. Looking at past deals, they seem to have paid roughly $1 million per location. This is fairly large compared to their $3 million well costs so it will impact IRR more than is the case for other companies.
For what it’s worth, I also noticed that the type curves vary quite a bit (~10% EUR, ~20% IRR) between their presentations.
I don’t think that its very accurate to value Sabine off of acreage and ignore the 3,400boe/d of production. I’ve never seen that done, and in fact its more often the acreage that’s the after thought and the existing production that determines the acquisition price.
Just reviewing my notes from the CC but I don’t think they are spending anywhere in the neighbourhood $1mm per location. Talking about the leases they bought, said it was 2,400 acres they added, didn’t give a price but said their total budget for leases is $20mm and they are in multiple discussions for new leases. Said they would provide cost once they had significant position achieved. At 5 wells per 640 you’d be pretty much there already if they were paying $1mm per location.
I see what you are saying with the type curve difference between the Barclays and Jefferies presentation. Thanks for pointing that out. I wonder if they are reporting the expected curve based on 2013 well results so far, and so they are adjusting those numbers each month based on production results. It does say 2013 Type Curve. Not very clear though, too bad there is no audio to go with the presentations.
If you look at the 2014 type curve it is different again and the oil rate seems like its gone up. Oil and Condensate appear to be overlapping after 51 months whereas oil was well below condensate in the 2013 curves.
Lsigurd, I agree that Sabine production should be taken into account. For Sabine, this implies perhaps a price per drill location of a quarter million dollars (after subtracting production at a conservative price per flowing barrel). I also did this exercise for other past deals, but I don’t have access to my notes. So I had another look at the Chalker deal and I now find roughly a quarter million per location. So the $1 million per location I named off the top of my head was perhaps not correct.
That’s pretty consistent with what I think.