Skip to content

Posts from the ‘Uncategorized’ Category

Another Banking Story – Eastern Bankshares

As I have dug into the bank stocks over the last few months, one thing that has crystalized for me is the importance of flexibility.

Apart from a few banks that aren’t really all that reliant on deposits, usually because they have other ancillary businesses that drive their income or because their loans are high-risk and what they pay for deposits is not that important, pretty much all the others are in the same boat.   Rising deposit costs and worries about commercial real estate dominate the risks.

What differs, sometimes significantly, is how much flexibility they have to deal with issues as they arise.

Eastern Bankshares is interesting for this reason.  On the surface EBC has many undesirable characteristics.  I can make a good case for why you would not want to buy this bank.  Yet if you look a bit further, EBC has one big thing going for it – flexibility – and that makes it pretty interesting, and I think could allow it to outperform.

What might make you skittish about Eastern Bankshares?  For one, EBC has a very narrow net interest margin.

Net interest margin is the difference between the yield on assets (loans and securities) and the cost of deposits.  Narrow is bad, particularly today.

EBC’s net interest margin has been well below 3% each quarter for the last year.  That is pretty low.  I talked about this in my last post.  I consider a NIM in the 3%s to be on the low-end of acceptable, and in the 2%’s I get nervous.

Having a tight NIM puts a bank in a tough position right now because they are more susceptible to rising deposit costs.  It is ironic that, as long as the economy is strong, it is actually safer to be invested in more risky, and higher interest, assets.

For example, if you are a bank invested in nothing but credit card loans at 19%, does it really matter much if your deposit costs go from 2% to 3%?  Nope.  But if your loans are low-risk real estate in the 4% range, it matters a lot.

The next thing about EBC is that they have a relatively large commercial real estate portfolio.

EBC operates in “the greater Boston area, specifically eastern and central Massachusetts, southern New Hampshire, including the seacoast region, and northern Rhode Island.”  Much of their loan portfolio consists of commercial real estate in this area.
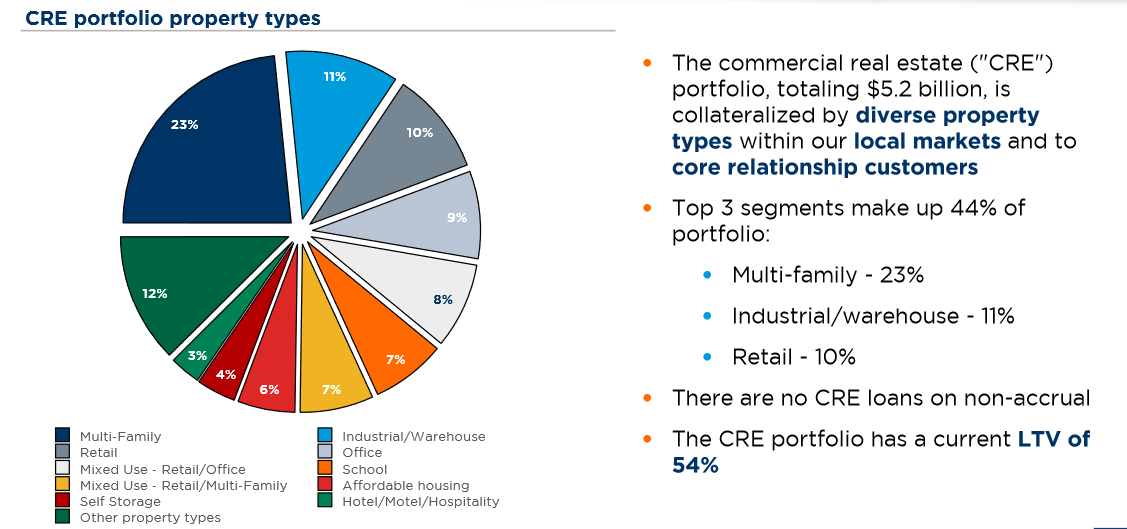
Of that CRE portfolio, office is a decent chunk.  Their office loans make up 9%.  Mixed use office + retail make up another 8%.
The composition of those office loans is average at best.  It is 2/3 suburban (so not big towers) but there is very little in the way of Class A properties. 
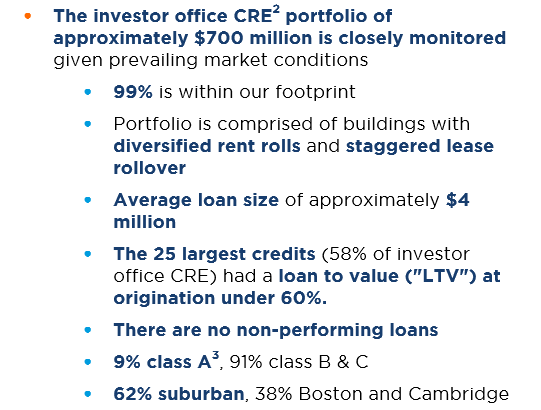
EBC did say on the Q1 call that they don’t consider any suburban office to be Class A so that makes the Class A/B,C breakdown look a little bit worse than it actually is.  But still, if 9% of their office loans are Class A and 38% of office loans are non-suburban, you can do the math.  They certainly have some exposure to downtown Class B and C properties, which is where most of the CRE stress is.

Finally, and this was the big worry going into 2023 – EBC had a big underwater securities portfolio.  At the end of 2022 their available-for-sales securities portfolio was $6.7b and had a $1.1b unrealized loss on it.
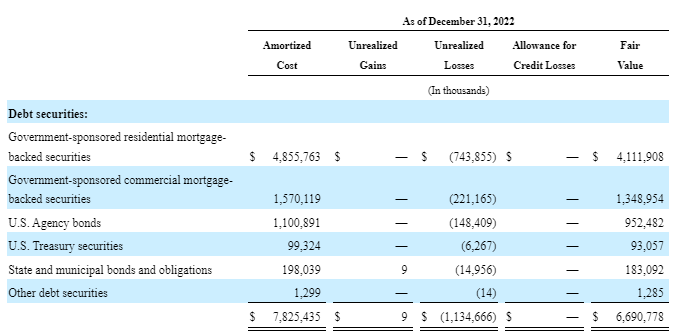
The securities portfolio was 30% of assets, which is sizable.   And compared to their $1.8b of tangible equity, the $1.1b unrealized loss was quite large (though because this is an AFS portfolio of securities, the loss has already been subtracted from tangible equity).

Ok, so those are the negatives.  Why in the world would I find this bank interesting?

Flexibility!

It starts with what EBC did with their AFS securities portfolio.  In March EBC sold a big chunk of it.  They ripped the proverbial band-aid off.

EBC sold $1.9b of securities during Q1, taking a loss of $280mm after-tax in the process.

Here is where flexibility comes in.  The reason EBC did this is because they could.  I have already explained how EBC positioned themselves poorly by buying a whole bunch of low yielding securities.  But they made up for this guffaw in another important way: by not levering up the bank risk and keeping around lots of excess capital.

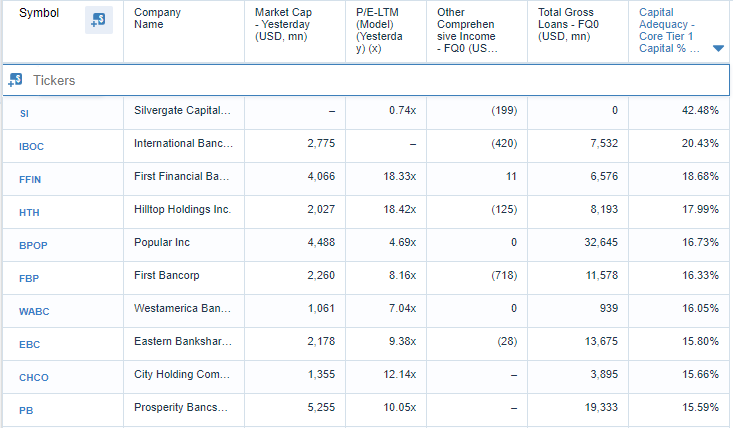
EBC has more capital than most banks.   The median KRE bank has core tier 1 equity ratio of 11.12%.  EBC has a CET1 ratio of 15.8% and that is after the sale of 25% of their security book.  EBC would stand 6th in the KRE in terms of CET1 ratio:
Second, EBC is not a very levered bank.  They have a loan to deposit ratio of 72%.  As I noted in my last post, a loan to deposit ratio in the low 70s is on the low-end of banks.  It is also far below where EBC was before COVID.  Their loan to deposit ratio was 93% at YE 2019. 

Having more equity at a time like now gives a bank options (you could say optionality but I hate that word).  Options like taking a loss on a security portfolio that is yielding only a bit over 1%.

And if you can do that, you get even more options.  Because now you can replace that asset with something yielding much more.  Or you can remove some of your highest-cost borrowing.

After the securities sale EBC had cash of $2.1b.  This is about 10% of assets.  It is way, way higher than it needs to be for a bank in normal times.  On an exchange with an analyst on the Q1 call EBC said they can reduce their cash level substantially:
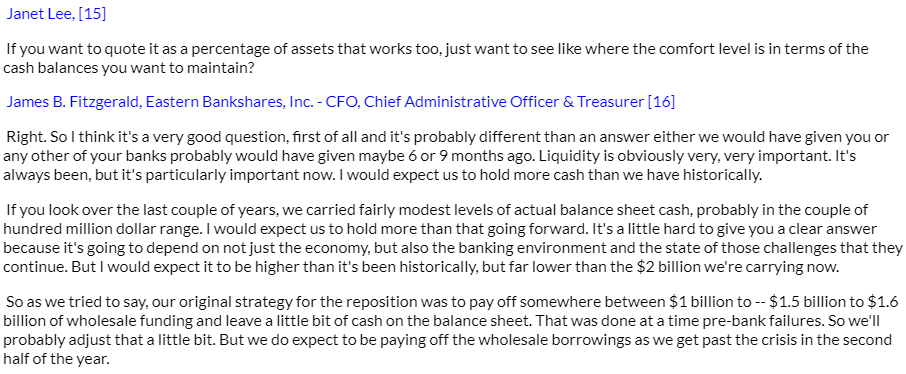
Historically EBC has operated with a couple hundred million of cash.  Right now, the sweet spot probably needs to be higher than that historic number, but still nowhere near $2.1b.

At the very least, EBC can use some of their cash to pay off some of their high-cost funding.  If you look at EBC’s balance sheet in Q1, they had $1.1b of FHLB advances and another $1.97b of CDs:

The FHLB advances have an interest rate of 4.6%.  The CDs have an average interest rate of 3.7%.

It is fair to assume (because they said so themselves) that EBC will use most of the cash to wipe out all their FHLB advances and let some of CDs run-off through to the end of the year. 

Eliminating the FHLB advances alone would have a big impact on earnings.  In my model of Q2 earnings, I calculate that simply moving excess cash to get rid of the FHLB advances (for the whole quarter) would move earnings from 29c EPS to 38c EPS.  Not bad.

CD run-off would help even more.  Because EBC has a low loan to deposit ratio, they can afford to let deposits run off without doing anything on the asset side.  The only thing is that I’m not sure whether a run-off of CDs will just be offsetting other deposit mix shifts from non-interest bearing to CDs, meaning cost wise its a wash.

EBC had planned to use the cash right away to pay off high cost funding but the banking panic delayed that.  On the Q1 call EBC said that after the banking panic in March they had decided to keep the cash on their balance sheet until things settled down a bit.  My best guess is that we will see the cash be put to better use in the second half of this year (but I’d be pleasantly surprised if it happened sometime in Q2).

Once they do, earnings will benefit.

Which is why EBC was able to do something that few banks are doing right now.  Raise guidance.

EBC said that they expected their net interest margin to increase through the rest of the year:

There aren’t too many banks that are seeing net interest margin going up.  In fact, the late-quarter conference appearances of banks that I listened to had most of them making reductions to  their Q2 NIM guidance.

Now remember, EBC is no perfect bank stock.  Their CRE and in particular office exposure could be a problem.  But even that might not be as bad as it looks.  This Bloomberg article pointed out that Boston is one of the better performing cities:
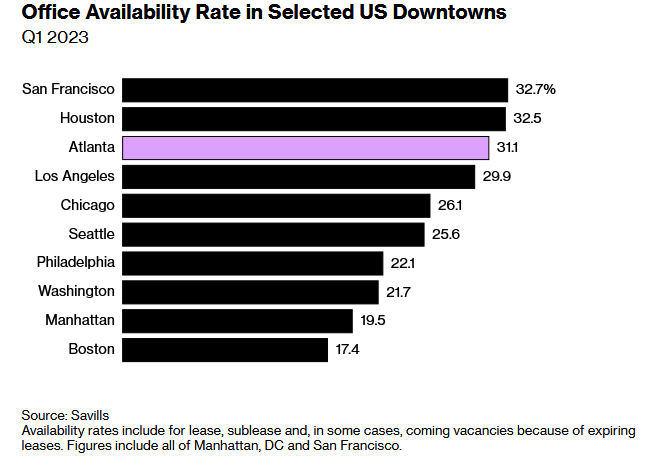
These charts from Morgan Stanley, albeit from earlier this year, also show Boston performing well compared to other major markets.

EBC is a lesson I think – of what flexibility can mean for a bank.  It was a bank in a tough spot to start the year.  But they had one trick up their sleeve: they began the year with the flexibility that comes from having low leverage and excess capital.

They used some of that capital to take a loss on extremely low yielding securities, which in turn gave them the flexibility that comes with cash.  Now they seem likely to use that cash to de-lever even further, reducing their high-cost borrowings.

But again, they have flexibility.  If the economy accelerates there is nothing to stop them from deploying that cash into loan growth, where they could likely get 7%+ on new originations, which would be even more accretive to EPS than paying down the FHLB.  Remember that EBC has a loan to deposit ratio of 73% vs. 93% pre-COVID.  There is plenty of room to grow their loan book if they believe the economy supports it.
The Preferred Bank Story

I research a lot of stocks. But I don’t write about most of them.

This is because most research leads to bland conclusions that aren’t really all that inspiring to write about.

For example, I spent a lot of time over the last two days learnign about Fastly.  I wrote 4 pages of notes.  I went through their investor day presentation, listened to the whole thing.  Went through their last couple conference calls.  Made a model.

But I’m not going to write about it.  There is not much to say.  At the end of the day, Fastly is going to be marginally profitable in 2026.  If the stock got down far enough (maybe $12) I might buy it.  But it would probably be for a trade.  Fastly trades at 13x their long-term goal operating income, which might happen before the end of the decade.  It’s a company worth following, but not exciting enough to write about.

To make an idea worth writing about you need some sort of tension.  Someone is right and someone is wrong.  Someone is missing something and here is what it is.

Otherwise, it is just Fastly should grow at blah, blah, blah and that gives us a positive operating earnings by blah, blah, blah and the discounted cash flow model says blah, blah, blah.

Boring.

Right now, a lot of my research is banks.  Which is essentially me doubling up on the boring-ness.  But there a few that make a good story.

There are two I plan to write about. Eastern Bankshares and Preferred Bank. This post is about Preferred Bank.

What makes Preferred a good story starts with it being a California bank. That puts it in the center of the crisis and a sorta-ish peer to other banks that have failed: SIVB and FRC.

Preferred operates in Los Angeles, Orange and SF counties.  They also have one branch in NY.  They are headquartered in Los Angeles.

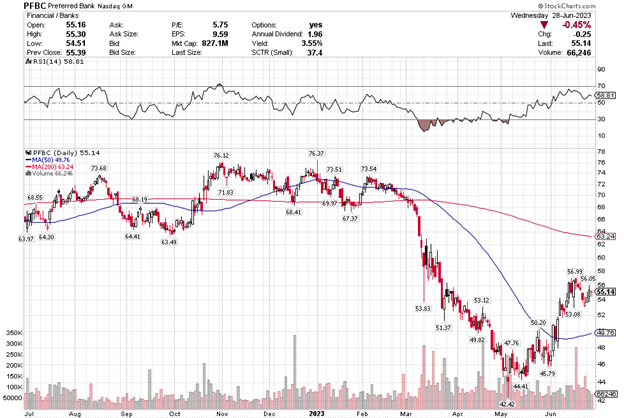
Preferred was square in the headlights over the last couple months and you see that in the stock chart.

Top to bottom, Preferred’s stock price dropped 40%.

The other thing that makes Preferred a good story is that they exemplify a theory of mine.  That’s right, I have a theory.  It is unproven.  My theory is that all regional banks are not actually the same.

While the word “regional banks” has come to denote the group as a whole, essentially a Borg, it is my postulation that this characterization is missing in nuance.

It is just a theory.  It is not widely accepted.

Let’s look at Preferred.  Preferred is not the perfect, riskless, bank.  This isn’t a story about that.  It has risks.  But most are different risks than say, FRC or SIVB.  This is a story about how Preferred is very different than the two banks in California that failed.

THE BANK

Preferred was founded as a Chinese-American bank.  They have evolved past that, they say they serve the “mainstream markets” of their areas, but they still benefit from migration from China and other parts of East Asia and I suspect a lot of their lending is to this demographic.

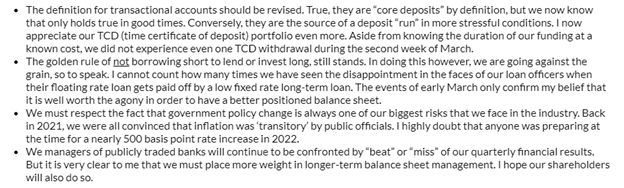
Geographically Preferred was in the middle of the crisis.  That made those few days in March some tough days.  The CEO Li Yu gave a lesson learned in the Q1 press release.

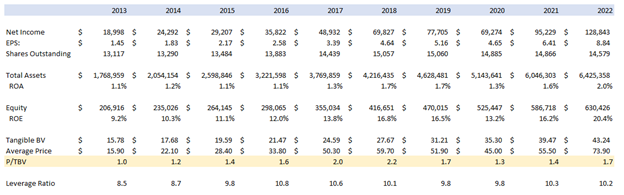
Nevertheless, the bank had a good first quarter.  They had earnings of $38 million, EPS of $2.61 per share.  Earnings increased 46% YoY but were $1.5 million less than Q4.

In Q1 Preferred had an extremely high ROA of 2.41% and an ROE of 24.47%.  Their efficiency ratio in Q1 2023 was 26%.

While this performance was on the high-side of their historical results it was not that unusual.  Historically Preferred has been a very strong performer, especially since 2017.

Return on assets since 2017 has been above 1.5% and return on equity above 15%. 

Over the last 9 years Preferred has had an earnings CAGR of 22.5%.  That seems pretty, pretty good.  I’ve never quite been able to figure out banks in this respect.  Earnings CAGR is earnings CAGR right?  Yet banks that grow earnings by 20%+ for 10 years barely a get multiple above 10x.

Of course, I am comparing banks to the real world.  In the bank valuation world the market has rewarded Preferred’s performance with a generous multiple well above tangible book value – generally between 1.5x and 2x, with a P/E of in the lofty range of 12-15x!

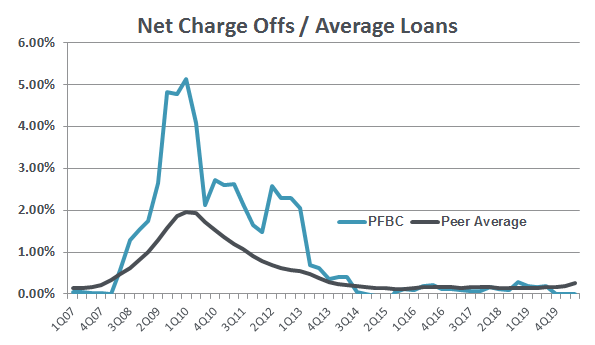
Now before I run away gushing about the bank performance, Preferred hasn’t always been an outperformer. During the Great Financial Crisis (GFC) Preferred did very poorly. They are California based lender, which was ground zero of the housing crisis. But what made matters worse is that Preferred lent to single family home builders. Obviously when the housing market turned, being long land and new construction housing in California was a disaster.

This SeekingAlpha article has a good chart that illustrates what happened.

So take that for what you will. Either a harbinger of what may come or a lesson learned. They have made a point on past calls to say they keep construction loans below 10% nowadays. Though, as I will point out, their loan book is not without risk.

Preferred did seem to out-earn in 2022 and Q1 of this year. This is likely due to the interest rate lag (loans getting repriced right away while deposits reprice slower).  But even if you plug in their historic ROE of 16.5%, in 2022 Preferred would have had $7.13 EPS – which at even 10x earnings would still be a $70 stock.

My conclusion? Since the GFC, Preferred has done well. They have a 10 year track record of growth. They seem like a well-run bank. They’ve certainly been a growing one, as assets have expanded about 4x since then.

THE LOAN BOOK

But FRC and, to a lessor extent, SIVB, were also well-run banks.

What makes Preferred different?

The first and main difference are what Preferred’s assets are.  You get a hint that something else is going on when you look at their large net interest margin (NIM). 

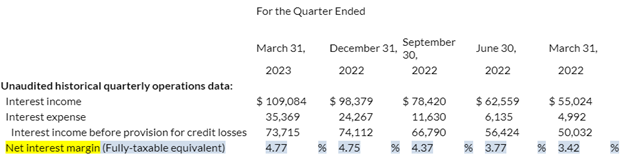
Preferred’s NIM has expanded every quarter since Q1 2023.  It was 4.77% in Q1 2023.  That is a high NIM.  One of the highest.  Remember that big banks like Comerica and Fifth Third have NIMs in the 3s.  Keybanc is actually below 3%.

The big reason that Preferred has such strong NIM is that almost all their loans are variable rate loans.  From an analyst question on the Q1 call:

I just wanted to get an update on kind of the health of your variable rate borrowers given that you got 80%, 85% of your loans variable rate, you’ve seen loan yields up 300 basis points from the lows.

Being so levered to variable rates means that Preferred is largely benefiting from the Fed tightening.

This is a bank that should like higher rates.  If rates go up virtually their entire loan book reprices up.  Their deposits?  They will reprice higher too, but not nearly as much.

Think about it this way – banks are all talking about deposit betas. Analysts are fretting that deposit betas are now rising to 45 or 50. Everyone has been freaking out about that.

What this is really saying is that the deposits will reprice to 45% – 50% of the rise in the Fed Funds rate.  Which is a lot higher than what was being said a quarter ago. But for Preferred, their loan book is already repricing 80-85% of the Fed Funds rate. They have a loan book beta (I’m making this term up) of 80-85.

That is not to say that Preferred doesn’t have rate risk with the loan book.  It does.  But it’s the opposite risk.  If rates come down, those loans will price down immediately and deposits will likely be more sticky.

The other risk, which is also a real one, is that their gain is their customers loss. Their customers are hurting by paying high variable rate loans. Now Preferred says this isn’t a problem, that all their clients are dealing with the higher rates, but you have to wonder how much stress it is causing.

Regardless, this is a bank that is geared to higher rates. So you would think that when the Fed talked about raising rates further that would be good for Preferred.

Yet what did the stock do after Powell talked rates up this week?

It went straight down with all the other banks that are negatively correlated to higher rates.

Ok, so that’s the rate sensitivity of the loan book at a glance.  Now let’s look at the loan composition.

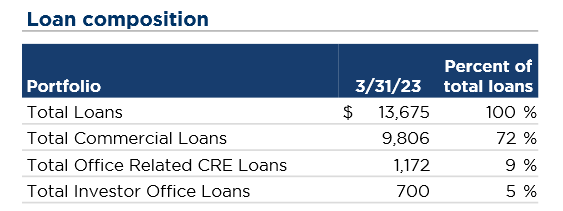
First the bad news.  Exhibit A: their loans are largely real estate.

Exhibit B: Of those $3.4b of real estate loans, $2.8b are commercial real estate.  And of that, Preferred has 10% of their loan book in office, or about $500mm.  This is quite a bit.

But just like all banks aren’t the same, all CRE is not the same and neither is all office CRE.  Where is Preferred’s office CRE?

First where they are not. They are not in downtown Los Angeles and only a very small amount is in downtown San Francisco.  They said they have one $8mm loan in SF which is not really made to anyone in the office-space maelstrom:

Of this amount, roughly $8 million is in the downtown area. We have faithfully have tried to avoid especially Los Angeles urban area for the past 20 years. And most of our office properties in the suburban area that in California, especially in Los Angeles, it’s a big, really suburban area. So there’s little communities everywhere and basically the property there is a lot more stable than the downtown area. And when we have the $8 million in downtown area is really in San Francisco that was leased and in the long-term lease to, I think, one of the famous university over there. It is very, very, how should I say, underwritten quite well is loan-to-value ratio probably less than 40% in any event.

Their office portfolio has an average LTV of 61% and average loan size of $4.1mm.  The largest 3 loans average about $40 million a piece.

Preferred went into a lot of detail on their top-4 office loans on the call:

The office building that is — one of the office building in the $50 million range is in one of the hottest areas in Los Angeles core, Culver City, which we have the creative and entertainment district, the first floor are all upscale — I mean they have upscale, good restaurants that do a bustling business. The second third floor is rented out to a new credit card type of company with LC support from a major bank. So that’s one. And also that we have a very rational, very reasonable sponsorship behind it.

The next largest one is in — is one of the buildings in Koreatown, the owner of that is rearranging the office building, making that office building near fully occupied and underwritten.

The owner of this office building is very, very, very substantial, very, very successful. And his credit in Los Angeles is it’s tough notch. Okay? Its cash flow is huge. So these are the top 2 as you have wanted to know, okay?

And I might explain the third one is in a very rich area of Newport Beach, where a group of people bought office building and my view, that group of people have dealt with us for many, many, many, many projects there. And a substantial group of people bought the office building and vacated everything and it’s going to demolish it and convert into apartments.

The fourth biggest office building is in the same category as the third.  It is being torn down to put up condos.

To sum that up: of the four biggest buildings, two of them are really construction loans where the office buildings are being torn down for condos.  One is a three story building in Culver City, a “hot” area of LA’s entertainment district with upscale restaurants and then offices above rented out to a credit card company.  And the last is in Koreatown and is fully occupied.

Just generally on how their credit is doing, Preferred said they “don’t have any nonaccrual or classified or even 30 to 89 days…in the office sector”.  There are no immediate credit concerns at least.

That doesn’t mean there won’t be though. The real risk with Preferred is credit risk – in a downturn. Banks are all about trade-offs and the trade-off Preferred makes is take rate for risk.

Preferred has reduced their exposure to construction loans since getting bowled over in the GFC. But they remain a heavy lender of real estate perm-loans.

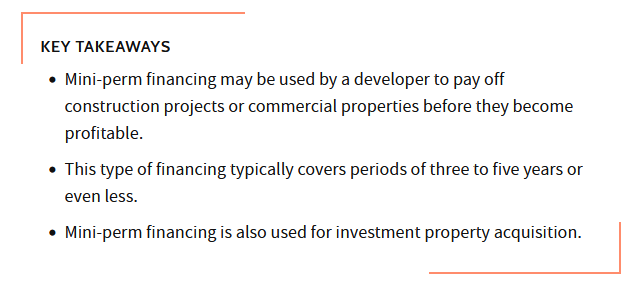
Perm-loans are bridge loans made after construction. They are short term (3-5 years, thus the term mini-perm which is short for mini-permanent).

These are higher risk loans because they are being made to newly constructed buildings that are not yet occupied. There is no cash flow at the start.

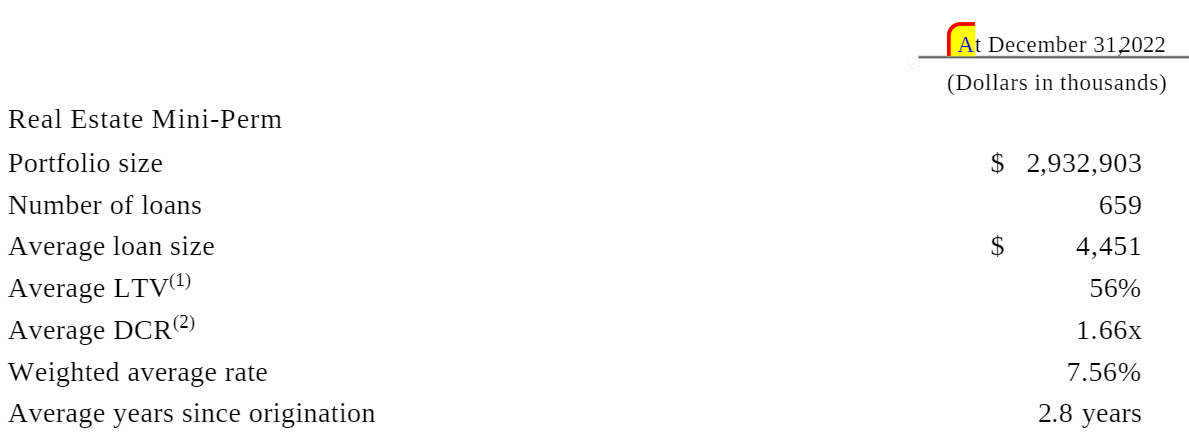
Mini-perm loans are about 60% of Preferred’s book. In a true downturn, this is definitely a risk.

So it’s not that there isn’t risk with Preferred.  It is just that it is not at all the same risk as SIVB or FRC. And Preferred shouldn’t be trading in lock step with fed funds, as if it were a bank that had half their portfolio in mortgage-backed securities.

Speaking of securities.  Preferred is the opposite of the failed banks. While SIVB and FRC owned a lot of government securities, Preferred doesn’t own much at all:

Preferred has a grand total of $400mm of securities at fair value.  $40mm of embedded losses.  The entire value is less than 10% of their balance sheet.  They have more cash than securities.

Given the lack of securities, they really don’t lose any meaningful book value (real or marked) on rising rates.  Which is kind of the point here.  This bank has positioned themselves to rising rates.  Yet the stock is behaving like they aren’t.

DEPOSITS

On deposits, Preferred is like other banks. Deposits are the one place where all banks (other than the largest regionals – like PNC and the money center banks like BofA and JPM) are the same.  All banks are experiencing higher deposit costs, fewer non-interest bearing deposits, and more CDs.

Preferred’s non-interest bearing deposits declined in Q1 2023.  Their non-interest bearing deposits are below anywhere they have been in the last 10 years.

And that has impacted their cost of deposits.  Preferred’s cost of deposits rose to 2.49% in the first quarter.

Preferred said on the Q1 call that in March their cost of deposits was 2.63%.  That means average costs for January and February was 2.46%.  It looks like their Q4 2022 average rate was 1.66%.

The conclusion? Deposits costs are most definitely increasing.  But that March number is not crazy high.  And given their loan book, it is going to take a much larger rise in their deposits to really bite into their earnings.

Being in California, Preferred did lose some deposits during those few days in March after SIVB collapsed.  But they have already gained some of those back.  From their Q1 call:

During the 3 days in March, March 9, March 11 and March 12 and March 13, okay?  The 3 working days.  Preferred Bank also experienced deposits outflow.  The good news is we have a total of less than 10 accounts that pull the money out.  The bad news is that 3 of them is very precised.  For the quarter, our deposit reduced or decreased by 2.7%.  As of yesterday evening, which is April 18, we have our deposits increased 1%, back increased 1%.

FWIW they are still advertising for new accounts at pretty decent rates. But so is just about every other bank not named JP Morgan or Bank of America (though I read even that is changing). So I don’t really know if this is saying as much as some suggest:

SUMMING IT UP

There are two points I’m trying to make here.

First, there is more nuance to banks than is given credit for.  All banks have risk. But those risk are not all the same. Not every California bank should be lumped in with FRC and SIVB just because they are in California.  I was listening to the Michael Campbell show this weekend.  He had Jim Thorne on, who btw made a nice case for a continuing bull market.  But at one point Thorne and Campbell start talking about regional banks, and it was the usual: The banking crisis is not over… commercial office buildings with loans coming due… there will be defaults… all of this falls at the feet of the regional banks.  It was the usual refrain.

Everyone talks about “regional banks” as though they were some kind of monolithic entity that moves as one.  The Borg.

Yet here is a bank that a Raymond James analyst said was “one of the most rate-sensitive banks around”.   Like I said at the start, between 80-85% of their loan book is variable rate.  Is this really the same risk?

My second point is rather simple.   Preferred is a bank with a 10 year history (really more) of growing EPS and the last 9 years it has done that at a 22% CAGR.  A week or so ago you could buy Preferred at about 1x TBV and well under 10x PE. Today it is 1.1x TBV and still well under 10x PE.

In a world where tech is valued at well over 10x sales for a revenue CAGR that is equal to or less than Preferred, and even after considering the risks in office, the risks in deposits, the risks in California, that doesn’t seem like a bad price.

Want to See It, Kinda See It, at Least I See the Numbers

I owned a few AI related names heading into this week – I had some PLTR, some INOD also some LPSN (which hasn’t worked, and I should probably dump).  I also own GOOGL of course.

The first two have been almost like placeholders, I don’t really trust them, but they keep my foot in the door just in case AI is as big as the hype.  I have kept my positions small enough so as not to do damage if it isn’t.  Because I haven’t been able to really “see it”, as they say.

I needed an ‘aha’ moment.  When I’m like oh, I get it, this is going to be huge.

As of today, I still don’t feel like I’ve quite had that aha moment.  But I’m closer to one after those NVDA results.

I just can’t ignore results like what NVDA released Thursday.  I mean to project nearly $4b more revenue in fiscal Q2 than analysts had expected is crazy. Something is going on here.  I still don’t know exactly what, what it means or who is going to benefit, but I have to pay attention here.

I remember the commodity boom of 2003-2007.  There was lots of poo pooing of the doublings that happened in a couple months at the start of that boom.  I’ve told the story before but I remember Aur Resources went from like $2 to $4 in a month or two after basically doing nothing for a decade.  And then I bought it, even though it made me ill.  But it turned out it was just the start of a 5 year move because of China.  Aur eventually got taken out over $40.

I don’t want to discount that possibility here.  That this is real and just the start.

I was actually short a little VICR heading into the NVDA results.  I know VICR well, I trade the stock back and forth because of that, and their outlook from the last earnings call was just so awful, while the stock had gone up to high-$40s, so it seemed like a decent swing short back to the low $40s.   But on Wednesday night I quickly covered and flipped long.

NVDA’s call not only said their H100 GPU was selling strong, but all their GPUs were selling strong and VICR has power conversion products on those other GPUs as well as other companies AI geared GPUs (VICR is also potentially going to be in the H100 at some point but that is a long story that would be an entire post).   I also bought some PATH, bought some SNOW and took smaller starters in IBM and HPE.

I don’t know if I will keep all those names.  I really don’t know what I’m doing here, at the moment there is an element of stabbing at the dark looking for winners, which is why all these positions are small.  I tend to act first and then look deeper because I don’t have the time.  I add and quickly subtract if I dig in and it doesn’t make sense.  I’ll probably have sold 2-3 of those names by mid next week and maybe added others as I figure out what I really want to own.

I still don’t really see “it”.  “It” being, how is this going to play out.   But what I do “see” now is how big the numbers can be.  The NVDA results were just so impressive.

I mean I look at the NVDA results.  The EPS forecast from analysts for their fiscal Q224 (current quarter) nearly doubled overnight from just over $1 per share to $2 per share.  It feels absolutely crazy to say this, but I don’t even know if NVDA is actually all that expensive here – and that is after the stock has gone up 4x in the last 6 months!  I mean if they keep beating estimates, what if they are doing $12 or $14 EPS in their fiscal 2025 (YE January 2025). Estimates for F2025 right now are at $10 but were $6 just 3 days ago!  $390 divided by 14 is 27x EPS.  Its not ridiculous.

So I see it, I see the numbers.  What I don’t see is how this impacts everyone else.  I can’t wrap my head around it yet.  Maybe the impact to IBM is negligible.  Maybe PATH is a loser in all this (LPSN seems to be).  Maybe PLTR is just full of BS with comments like this (from their Q1 earnings call):

in the last 20 years, there’s never been a development like this. You have a technology that will allow you to outproduce, change the margin of your company, understand your business, react on the battlefield quicker, predict things on the battlefield in a way, collapse your enterprise so that the top and the bottom actually work together, preempt attacks, create a software that is so obviously dominant that adversaries quiver and scurry away instead of attacking us or our allies.

I bought PLTR right after reading this earnings transcript.  I remember saying to my wife, I don’t know if these guys are full of shit or not, and they very well may be, but if anyone believes what they are saying, the stock is going up.

I was sitting at the kitchen table that night and i said to her: “I have no idea what is going on here or why this is AI is a big deal but there are companies losing their shit over this.” True story.

Flash forward to today and I still have no clue what to believe. Which is why its difficult to write this post.  You want to write to inform.  But I am writing to say, “I think there might be something going on here.  I don’t really understand it.  TBH it kinda triggers my BS meter.  But I’m wading in further”. 

Great thesis.

You gotta listen to the market.  Right now, the market is saying there is something going on, and this feels like it could be the start of one of those secular changes.

You can easily call these moves a bubble or irrational or a blow off top.  The chart of NVDA certainly looks like that.  But sometimes these things are legitimate secular moves.   Again, I can’t shake my copper analogy.  If it hadn’t been for Donald Coxe looking at those same copper stock charts up 50%-100% in a few months and saying you have to buy these things now, I never would have had the courage or insight to do it.

I just want to have that broader aha moment for what AI can do for so many stocks to go along with what I had (too late) this week for NVDA.   Unfortunately, its not as obvious as a “1 billion people moving from china countryside to cities” where the thesis just jumps off the page at you.  But that also means opportunity.   My suspicion is that some of the winners are going to be losers and vice versa.  That should mean lots of opportunities for the next while.  If I can only figure them out.

Well That’s Surprising

I’ve spent the last 3 posts looking at banks.  And it’s not going to stop.   Because this is what I find interesting right now.

From post #1 to post #3 my view has changed significantly.  I went from ‘OMG this is a disaster’ to ‘you know some banks should hold up okay’ to ‘its really weird how big the gap there is between what the stock price is doing and what bank management is guiding to’.

All the time I scratch my head and wonder how it will end?

My next installment is a ‘well that’s surprising’ post.  That is to say: ‘well that’s surprising’ that one of the banks at the center of the maelstrom actually doesn’t look like a complete disaster even when I model it out in very stressed scenarios.

The bank I’m talking about is Western Alliance Bancorporation.  Its right in the middle of this.  RIGHT in the middle.  It was hammered down to single digits when Silicon Bank went belly up, it was hammered down again when First Republic went belly up, it was bought by Chris Whalen at the peak of the crisis and then sold by Chris Whalen at what is now being called the Whalen bottom.  You couldn’t be more in the middle.

Now I just want to preface all this by saying I don’t own WAL.  I have no intention of owning WAL.  My conclusion is that they are at best walking a tight rope.  And they aren’t all that cheap compared to other banks out there given the potential for further distress.  So don’t turn me into a WAL bull.

But the way the stock performs (absent the rally this week) you’d expect things to be extremely dire.   What I found instead was that things were more like ‘not great’.

Like I said in the last post, as much as anything I’m putting my thoughts down for my own record – so I can go back and say ahh, that’s what I missed.

Onto WAL.

WAL is interesting for a few reasons.  First, this is not a security heavy bank.  They aren’t like Silicon Bank with massive MTM losses on Treasuries and mortgage-backed securities.

Second, WAL originates loans with a pretty high interest rate.  The average rate on WAL’s loans in Q1 2023 was 6.28%.  Compare this to say Keycorp – which had 5.04%.

Of course, that means that WAL loans should be riskier.   And they probably are.  But right now, with the economy still apparently trucking along, that riskiness isn’t bearing out into much higher loan losses.  So in a weird twist of fate, banks like WAL look better, at least on paper, because their higher rate loans can cover the rise in deposit costs better.

For WAL, the combination of high-rate loans and a relatively small portion of (low-rate) investment securities means that their net interest margin was not terrible in Q1, even though their deposit cost rose a lot.

Now that is going to get way worse in Q2 and beyond because WAL has seen an outflow of deposits since. To plug the hole they are tapping higher cost sources of deposits (or the Fed) to replace them.So far, no surprise.  This is where you would expect disaster.  Higher deposit costs, a collapse in net interest margin, a general mess.

What surprised me is that when I look at WAL and put some fairly significant stress on their deposits, I don’t get a complete disaster.   It is not exactly rosy, but it wasn’t nearly as bad as I thought it would be.

My assumptions started with management guidance.  Take that FWIW.

I tried to stay consistent with WAL’s loan growth and deposit growth estimate.  These are two things that management can control.

I did not follow management guidance for net interest margin, efficiency or pre-provision net revenue estimate because I wanted to assume much higher deposit costs, which throws off all of these metrics.

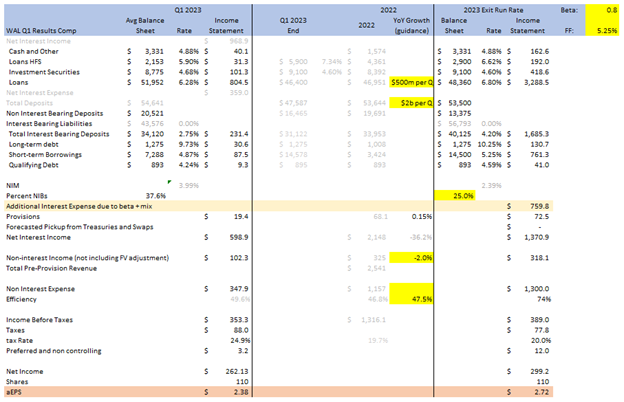
Essentially, I am assuming that WAL can build back their deposits but at a painful price.  The key assumption I’ve made, and really this is just a guess, is that WAL has a deposit beta of 80% by the end of the year.  That means that if the Fed keeps rates at 5.25%, WAL will have deposit costs of 5.25% x 0.8 = 4.2%. Which is pretty high.

Below is what I get for earnings.  Now this is kind of a pseudo-run rate on earnings.  I’m not trying to come up with a 2023 number or a 2024 number.   It is more of an annualized steady-state look of where things could be at YE in a distressed scenario.

It is not great, but it is not terrible.  Of course, to put it in context, WAL made almost $10 EPS last year.  So it is a massive drop in profitability.  But they are still profitable, which is more than I would have expected.

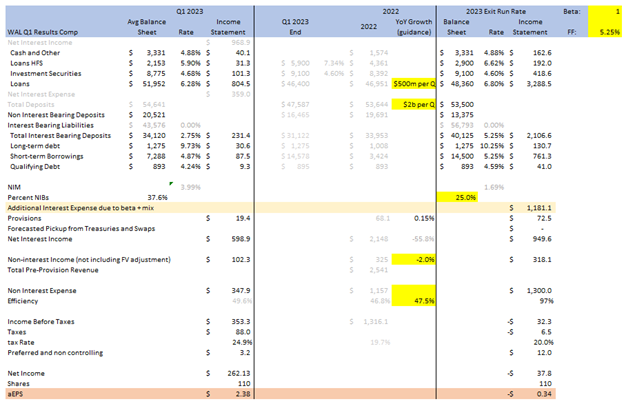
Next, I assumed the absolutely apocalyptic case where deposit costs go right up to the Fed Funds rate (Beta = 1).  In this case, as you might expect, EPS goes negative, but surprisingly it is still less than a $1/share loss.  I would have expected much worse?

Why are these estimates are better than I would have expected? I think it comes down to WAL’s high interest rate loans that can cover the deposit costs (and most of the other non-interest expense) even when those deposit costs are through the roof.  WAL also has a strong mortgage business that delivers fee income (their non-interest income was $100 million in Q1).

There are plenty of caveats to consider with these numbers. For one, I am not thinking about credit quality at all here. If WAL’s loans start to go south, things would fall apart quickly.

WAL has also entered this hyper-sensitivity zone where the numbers are extra sensitive to changes in assumptions as you get closer to break-even. It becomes a precarious tight rope.  For example, if non-interest bearing deposits drop to 20% (instead of the 25% I assumed), EPS drops to $1.90 and -$1.37 per share for the two scenarios.  It doesn’t take much for things to spiral down.

Which is why I am absolutely not saying WAL is a stock I am looking to buy.  I mean it would be trading at >10x earnings on my 80% beta stressed case. That situation is not implausible. There are plenty of banks that have lower PE’s without all the distress and certainly not the battleground element.

Nevertheless, it strikes me as interesting that even with a battleground stock and what should be some very extreme assumptions, I don’t get a complete disaster of a result. Surprising!