Skip to content

Posts from the ‘Uncategorized’ Category

Are all the banks the same?

Thursday I tweeted the following:
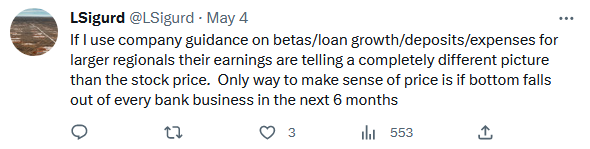
It seems like pretty much everyone is saying that the regional banks are hooped.  You’ve got Chris Whalen saying that ALLY and COF are next.   You have Hugh Hendry coming out on Bloomberg saying that its going to get “real bad” and that he suspects “fed officials are considering a lock on bank deposits”.  Jim Bianco said on the Forward Guidance podcast that “everyone is demanding their money back right away”. 

This is almost no differentiation made when banks are talked about.  They are simply referred to as “the regional banks”.   All 4,000+ of them (community banks included).

It should thus be no surprise that this last move down has not discriminated much.  It has just been an across the board wipe out.

But are all banks facing the same stress? 

Here’s what I did last week.  I took a bunch of the larger regional banks that provided FY 2023 guidance with their Q1 results and I roughed out the numbers of what their earning might look like.

I kept reading on Twitter that the move in the regional banks was justified because regional banks earnings are becoming so impaired.

So surely this must mean that regional banks guidance for 2023 has come down dramatically?  I mean they reported only two weeks ago.  And this after the blow-ups of all but FRC.  Some of this impairments must be in the guides, right?

I was curious how bad it would be.

I didn’t use any crazy assumptions.  I pretty much stuck with A. what the company guided to and B. what first quarter results were.

Here is what those results looked like for two fairly large regional banks that have been hit quite hard in the last week and even harder in the last month and a half: FITB and KEY.

Fifth Third Bancorp

Starting with FITB, here is the guidance they gave on their Q1 call:
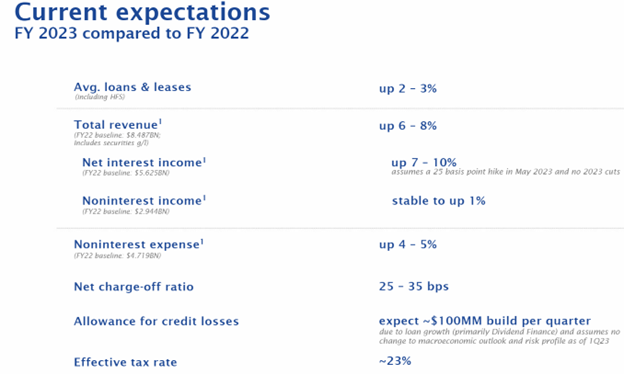
Loans up, net interest income up, non interest income up, expenses up. 

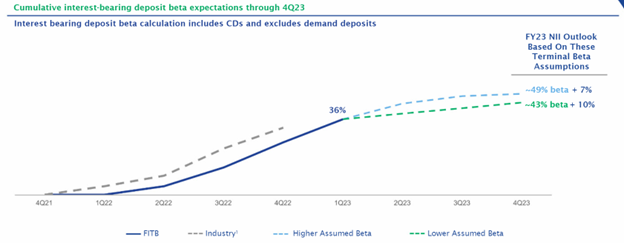
FITB gave the following guidance for deposit betas.   I used 45% for my average, which I ballpark is about inline with their worst-case scenario where beta reaches 49% by the end of Q423:
FITB also gave us their average interest assets and liabilities table on Page 21 of their Q1 Earnings Release.

From this information, in the spreadsheet below I essentially reconciled guidance and Q1 results to come up with what earnings would look like to be inline with it all.

I played around with loan and security yields to get something close to the net interest margin growth they guided to (note I ended up with 7.1% vs their 7-10% range).

Bright yellow cells are guidance or estimates.  The grey cells are used for comparison but not in the calculations.  The cell described at “Additional Interest Expense due to beta + mix” is just the FY 2023 deposit cost less the Q1 2023 deposit cost annualized.  I added this calculation to see just how much the additional deposit cost of rising beta and lower non-interest bearing deposits is to each bank.
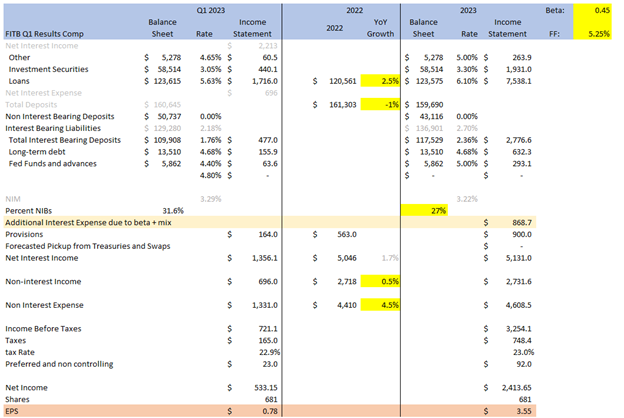
It is a curious result.  All in, FITB earnings come out at $3.55 EPS.  Their NIM declines slightly even though their interest-bearing deposit costs rise from 1.76% to an average of 2.36% (because their loans and securities continue to earn more as well).

In addition to the guidance, I assumed provision for loan losses increases as the year goes on (averaging $184mm per quarter for the rest of the year).  I also assumed non-interest-bearing deposits decline from 31.6% to a 27% average – which would be consistent with a year-end number of about ~25% NIBs. 

Keycorp

I did the same thing for KEY.  Now KEY had a bad Q1.  They missed on their estimates and lowered their guide.  When I set out to work through what this meant for 2023, I thought the result may be quite ugly.  After all, consider Mike Mayo’s comment for KEY during the Q&A:

It’s rough when an analyst is calling you out like that.  This was KEY’s outlook:
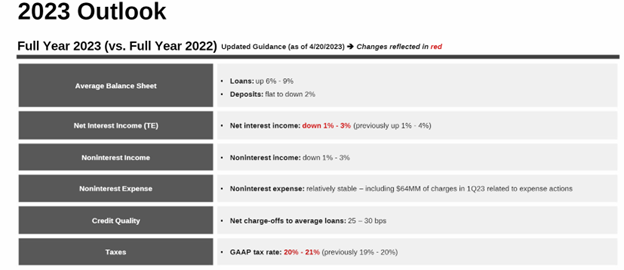
They lowered net interest income and increased their tax rate.

KEY gave us an estimate of deposit betas “peaking in the low-40s”. 

KEY also gave one other data point that is interesting.  Below is the impact on net interest income of the rollover of short-term securities.  This impact is fairly low for 2023 ($79 million total) but it increases a lot going into 2024.  I think it is interesting because much of what we are told implies that the banks will only face rising costs and that they have nothing to offset those costs.
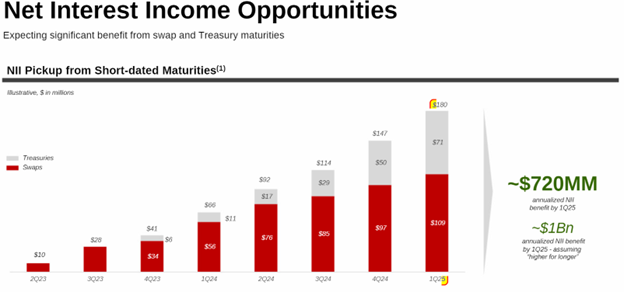
I included this in the line Forecasted Pickup from Treasuries and Swaps.

And here is what KEY’s forecast looks like.  Again, bright yellow are their estimates, grey are used for comparison not in calculations.
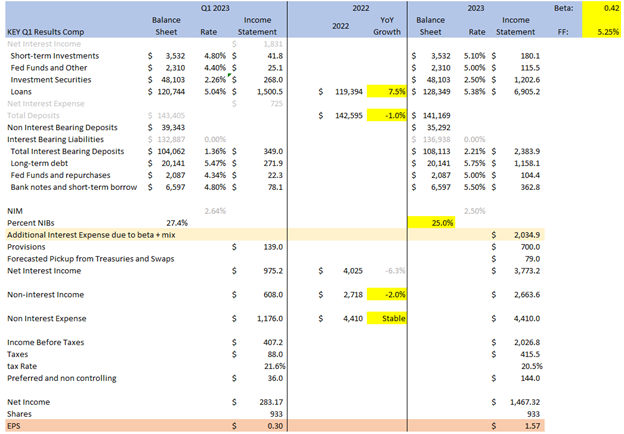
Surprising.  KEY earnings come in at $1.57 per share.

I don’t know, I mean I welcome anyone to go through these numbers and see where they might be wrong.  But they are essentially built from management guidance so unless I have a math error, there isn’t a lot else that could be going on.

So I don’t know, what am I missing?  Why did KEY fall 10% on Thursday into the $8’s, FITB fall 7% to nearly a new 52-week low?  All I saw on twitter was that the regional banks are in trouble and the fall in the regional banks is justified and regional banks are facing deposit runs and regional banks business model is fundamentally impaired.

There are really two things that can wrong with these two banks:

  1. Their deposit costs could come in much higher than they are estimating.
  2. Their loan book could have far more defaults.

On point #1, this has to be the biggest unknown.  Will deposit costs go up even more?  Will betas (measured as deposit costs as a percentage of the Fed Funds rate) far exceed historical norms? This has to be what a big part of what the market is pricing in.  After all, deposit costs rose a lot in Q1.  Maybe this is just the start.

On the other hand, Q1 may have been the peak for beta velocity. Rate increases have slowed. Beta lags, which means Q1 was pricing in much of the extremely fast rate velocity of late-2022. Will it really just keep accelerating?

I don’t know, but I wanted to look at what happened if beta got really bad. If I add 20 points to the beta of KEY and FITB, bringing it up to 62% and 65% respectively, earnings at KEY go down to $0.61 per share and FITB down to $2.25 per share.

That is a steep decline. 

But a 60% deposit beta would be extremely high compared to historical standards.  I went back and looked at what banks were saying when they were modeling beta early in the cycle.  KEY was saying that 30% was roughly the historical average.  FITB said the previous cycle (which did have a much lower terminal rate) was 38%.  We are already looking at numbers above that and if it gets to 60%, it would be way, way above that.

Could it really go that high? I don’t know. But this unknown has to be the big risk right now. If there is a second order comment to be made it is that if beta goes that high, the bank earnings get very sensitive to small changes. For example, KEY with 62% beta gives me 61c EPS. At 60% beta its 70c. At 65% beta its 46c.

The other thing that could go wrong is the loan book.  KEY and FITB aren’t particularly exposed to commercial real estate (8.9% and 8.4% of total loans respectively).  Some regionals, particularly the smaller one’s, have CRE exposure that is so large that really you have to take their earnings with a grain of salt if you think CRE is in trouble.

But if CRE becomes such a big problem that KEY and FITB are stressed by it, there are 3 out of 4 of the banks in the country, including some bigger one’s than these two, that will be in big trouble.

We will see.  Going into last week I had a few shorts on regional banks that were A. exposed heavily to CRE, B. had very high and rising deposit costs and C. saw their NIM shrink a lot in Q1.  On Thursday I covered most of those and I went long KEY and MTB (I am already long PNC) for a short-term trade.   
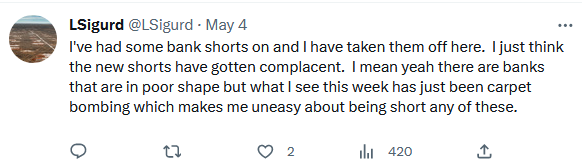
While this feels like anything but a fat-pitch (I’m not convinced that the worst if over given where the economy is and where it may cause inflation to go and I really have no clue how high deposit costs go over the long-run) it is a trade that worked out at least for Friday.   We’ll see if that continues.

The thesis is that A. management isn’t lying about their outlook based on where they see things now, B. that shorts have gotten complacent and are just shorting the regional bank index (KRE) which is dragging down all banks when not all banks are in the same boat. C. nothing in the economy or in their business is deteriorating as rapidly as the stock prices suggest it is.

What I Learned from Reading Bank Reports

Every quarter I read through a bunch of bank reports and earning calls.

Honestly, it’s a little dry.

I already wrote about what happened last fall when I went through the Q2 2022 reports.  In September I had a bit of a WTF moment as I saw:

  1. The tangible book value of almost every bank collapse – some by 30-40%
  2. No one seeming to care that this had just happened

I wrote at the time:

Again, I don’t know what to make of these OCI hits. Do they matter? I’m not sure. They certainly make the bank look more expensive on a book value basis. Post the OCI hit, the bank is closer to running into regulatory trouble if something goes wrong with its loan book. OCI hits don’t impact earnings, though as I said they might impact the ability to grow earnings in the future.

Just to be safe, I’ve stayed away from banks with big securities portfolios that are taking big OCI hits. Funnily, its either the very small banks or very large banks that aren’t having to do that. The small banks don’t own a lot of securities. the largest one’s (like C, BAC or JPM) seem to be better at hedging their exposure.

I was just kind of like – does this matter?  And I concluded that it probably didn’t matter.  Unless someone decided it mattered.  And then it might matter a lot.  So it was best to just stay away, just in case.

This quarter (q1 2023) I did the same thing I always do except even moreso.  I’ve read through a lot of reports and calls.

I went into this quarter thinking there might be another big “Holy Cow” moment from hearing what the bankers had to say.   But you know, there wasn’t.

Instead, the problem I think is more insidious.  Insidious – harmful but in a gradual, subtle way that takes time to show what is really going on.  It is the frog slowing boiling and not knowing it analogy.

The problem, which we all know, is that short term rates went from 1% to 5% in a year and banks can’t adjust to that fast enough.  I mean that’s really it.  Everything else is a consequence of that.

Consequence #1 is that deposit costs are just dripping upwards every day.  I pointed this out in my post on PNC.  Some banks saw 50 bps increases to their deposits in Q1.  Some saw as much as 100 bps increases.  But it’s going up for all of them.

The loan books can’t go up as quickly.  In part that is because they already have moved up, which pushed this problem from last year to this year.  In part it is because a bank can only roll over at most 20% of their loan book in a year.  And also only in part because some of the loans are variable rate which do go up and down with short term rates.

There are lots of factors.  Things can be very different depending on the bank.  What really matters is the net interest margin (NIM) – the spread between what the bank lends at and what they pay for deposits.  In Q1 some banks saw their NIM fall quite a bit as deposits rose and their loan and security book didn’t rise with it.  That isn’t a good thing.

But not all banks saw this.  For some NIM just moved down a little.  And some banks that had very “sticky” deposits or a lot of variable loans actually saw their NIM rise.

But most saw it fall at least a bit.  And it will fall again in Q2.   Now again, another nuance: some banks will try to offset this falling NIM with new loans.  And you heard that on various calls.  We’ll grow our way out of it.

But other banks can’t do this so they didn’t really talk about it.  These banks have a lot of loans on their balance sheet already (loan to deposit ratios of >100 while FRC, that bank that just failed, was actually only 95 in comparison) and so they can’t make a lot of new loans.  They are kind of stuck.

If you see a bank with a smallish NIM to begin with (<3% or yikes, <2.5%) and high loan/deposit ratio, that’s not a good thing.

Another thing I noticed is that most of these smaller banks own a lot of commercial real estate loans.  Bank after bank has 30% or 40% CRE.  The outliers have 90%+.  Very few banks don’t have significant exposure to CRE of one type or another.

Now not all of that is office.  There is industrial, retail, multifamily.  The one’s that have office are in probably the most hot water, and you can see that because every bank that didn’t have big office exposure told us they didn’t have big office exposure.

You get a hint of the problems with office exposure every once in a while.  For example, consider the following exchanges from one bank call:

And then later in the call:

As Seinfeld said, that’s a big matzah ball! 

So there’s office.  Its not great.  There are pockets of multifamily that aren’t great if you can’t raise rents (like in NYC or hmm, there was some city in Canada that did something like this, it will come to me…).  There are malls.  Lots of stuff that is a bit wobbly.

But I don’t think in and of itself these CRE loans would be a problem.   The banks would manage out of it.  It is like I said, every bank is different.  Some are more exposed, some less, a few will stumble, most won’t.

The bigger issue is Consequence #2 of the rise in rates.   And that is that the loan books of all the banks, every one of them, is underwater.

Any bank that wrote a fixed rate loan between 2020 and 2022 is underwater now.  Its not really their fault, its just the way it is.  They made the loan when fed funds were 0% and treasury rates were 1% and now rates are higher and so the loan is worth less.

Now NO BANKS talk about this on their conference calls.  There wasn’t one bank that talked about the mark to market of their loan book.  Because its not a good thing.  It’s a lot like OCI was last fall – better left unsaid and it isn’t a problem unless someone decides it is a problem.

Which brings up one interesting thing I did a couple weeks ago.  I went way all the way back to the summer of 2008 and read what a bunch of banks said on their Q2 2008 conference calls.

This was like 3 months before all hell broke loose.   And you know what?  They didn’t have a clue.  Or at least, they weren’t going to say it.

The best you got out of bank comments was a bit about tightening conditions at the edges, a little weakness here or there.  Seems like housing is a little weak.  Absolutely no blazing red flags.

So you can’t just listen to what they say.

I suspect that one of the reasons the banks have fallen out of bed this week is because when FRC went belly up over the weekend and was bought by JP Morgan, the loan book was bought for about a 13% discount and that is with a loss sharing agreement.

Think about that for a second.  The entire loan book of FRC is worth 13% less than the number on the balance sheet.

What would that mean if you had to sell the loans at fair value for every other bank tomorrow?

Again, its nuanced – some banks would be fine, others would be not so much.  But I’ll tell you, when this whole thing started back in March I went through the 10-Ks of about 30 banks and what I saw, where it was reported, was an average loan book down ~10% when it was marked to market (this wasn’t quite hidden at the end of the 10-K so you really had to hunt for it, but it was often disclosed).

It was pointed out somewhere that there were about $25-$30 trillion of loans made in 2020 and 2021 (I’m not sure if that is just banks or all financial entities, I’m getting this second hand but I think that number is ballpark right), when rates were super-duper low.  If you do the mark to market loss on that at a 15% haircut, that is in the range of $4 trillion of mark-to-market losses, just sitting there.

Now does that matter?  It doesn’t really matter if no one cares.  Its all held on the balance sheet of banks who don’t really want to sell it so if they don’t have to sell it then who cares.  But if it starts to matter, it would REALLY matter.

Which is why I just need to be a little bit careful here.

No Fat Pitches

My process, if you can call it that, goes something like this:

I have a whole bunch of ideas.  These ideas have taken the form of stock trades.  Some are working and some are not.  Most of the time more are working than those that are not.  But sometimes, usually at least a couple of times a year, that flips.

I start losing money.  Losing money makes me antsy.   Then angry.  This anger leads to disgust.  The disgust eventually leads me to go on a selling rampage – throwing in the towel on many names and what keeping many others in smaller quantities.

At that point I go through a period of mild depression.  All those hopes and dreams from the stocks I have just sold are lost.  I am left to reconcile my new portfolio level, which is inevitably off the highs, instead of clinging to the hope that the same names that led it down will lead it back up again.

But then I come out of this period of despair.  I suddenly feel invigorated again.  Why?  Because I have opportunity.  I have cash.  I have decisions to make.  I am not stuck with past decisions that aren’t working.  Many times, I never look again at the stocks I just sold.  If I do it is with new eyes.   Why do I own this?  Why should it go up?  If it’s a short – why should it go down now.

I start looking at new names, thinking of new ideas, having lots of cash opens up opportunity rather than it seeming like a burden to managing finite capital.   I spend my time trying to figure out where the fat pitch is instead of hoping that it comes from something I already own but that isn’t panning out.

This is the same process I have gone through for 10+ years. The only thing that has changed is my risk tolerance. It used to happen on a 10% drawdown. Today, its more like 2%.

I just went through this process in the past week.   We got earnings season and I got whacked.   First Thursday on Impinj and then Friday on Snap/Sentinel/Crowdstrike.  At that point I said enough, I’m clearly NOT thinking clearly, and sold a whole bunch of everything.

As it often happens, as I work my way from despair to invigorated, I get sent something that puts it all in perspective.  This time a friend sent me a great little interview from Stanley Druckenmiller that really summed it all up.

Druckenmiller is pretty, pretty negative.   Or at least unsure.  Well negative – after all he is in the “hard landing camp”.  When Stanley Druckenmiller says he is more uncertain about the market than any time in his 40 years, that is saying something.

But the comment that summed it up to me is when he said – I don’t see any fat pitches right now.

I hadn’t really thought of it that way until he said it, but its really what I’m feeling right now.

2022 was actually kind of easy.  At least straightforward.  Try to stay out of the way of the freight train.  The first couple months of 2023 wasn’t too bad either – just look for a bounce.  But now?   Man, its hard to know.  Are we still bouncing, is this back to a 2022 playbook, or something altogether different?

That isn’t to say there aren’t promising stocks out there.  There are.  But where we are with the market, the economy, it just makes me reluctant to call them a fat pitch.   A fat pitch is when it all lines up.  There are plenty of stocks, especially in the micro-cap world that has been really hit hard, where the valuation looks quite attractive.  But with rates at 5%, with the market up here well above 4,000, I just don’t know if I want to pull the trigger on them.

I have survived the last 2 years. I have not lost money yet and have actually made a little money mostly on account of shorts and GICs even as the market has gone down a decent amount. I have done this by:

  1. Being cautious
  2. Selling when it isn’t working
  3. Taking only small positions in just about everything
  4. Always being hedged

Here is what I have not done.  I have NOT survived because of my incredible stock picking ability. 

I simply haven’t.  I wish the opposite was true.  I’d love to say I’m Michael Burry and I have found multi-baggers in the bear market. But unfortunately, no. I’ve had some nice winners over the last two years and some equally terrible losers.  Even this year, I’ve done better on the short side then the long side (which is really weird to me given the market we’ve had).  Overall what has kept me in the game is the process (essentially puking up whatever is not working quickly) and not the picks.

In fact I have been best served by scalping profits quickly when I do have gains.  Take Impinj for example, which was a mess this week.  I sold half before earnings on no other reason than the knowledge of my own fallibility. This helped offset the massive drop on Thursday.

Apart from a few large caps it just isn’t paying to buy and hold in hopes of a larger trend.  Unless you have more knowledge about the business than I can divine from conference calls and earnings releases.

As I lean into Druckenmiller and his ‘hell if I know’ thoughts about the market right now, I think that remains the path to be on.   There’s gotta be a really good bull market out there at some point, and when that happens I can try to rack up another one of those years, but until it feels like its coming, I gotta stick to the process that keeps me in the game.

Trying to be Better at Evaluating Banks – PNC

In my last post I made a decidedly poor attempt of figuring out where the banks are going.

I didn’t think through my assumptions. Because of that my guesstimates were off.  When I thought about it more, I realized that I was effectively using the average loan interest rate for the entire year 2022.  That meant that my average included about half a year of very low rates.  And this meant that I was using an inaccurate depiction of earnings sensitivity going forward.

Hopefully I do a better job this time.

We have seen the reports of a few banks for the first quarter.  I can use Q1 numbers to look at the same sort of sensitivity as I did before, but with more detail and more recent baselines.  If I make some assumptions about where deposit rates might go,  I can come up with where earnings might go – hopefully with more accuracy than before.

I am going to start with one of the bigger regional banks that has reported, PNC Financial.

PNC is not anywhere close to the center of the deposit runs we had in March.  It is safe to assume that PNC is more likely to have deposits run to them than run away.

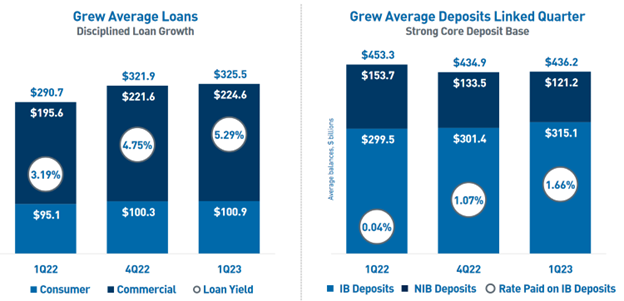
You saw some of that in Q1.  PNC saw deposits grow QoQ.

Clearly there is no “bank run” concern here.  The concern, if there is one, has to do with what those deposits are going to cost in the next few quarters and how much that is going to hit their bottom line.

PNC provided very good color around both their deposits and their loan book this quarter. That is why I am using them as a test-case of sorts. The earnings reports of smaller banks are hard to figure out until the 10-Q is released.

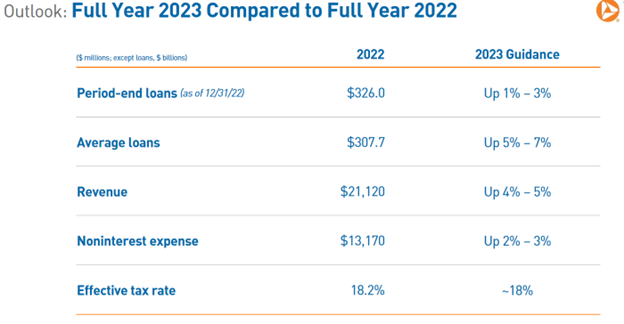
Let’s start with PNC’s guidance. This is what they are guiding to in 2023.

It is not a ton of detail, but along with the deposit information below, it is enough.

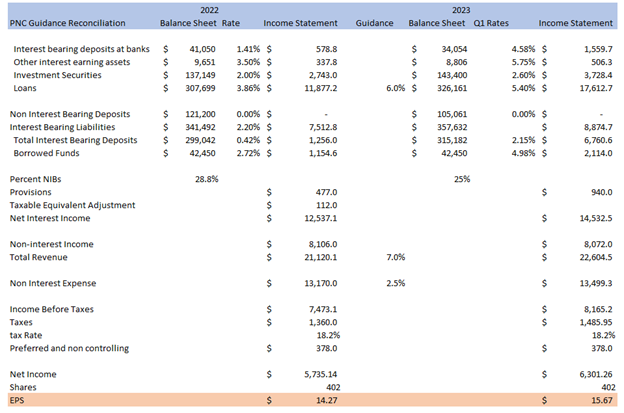
What I have done below is extrapolate earnings from PNC’s guidance.  This estimate is based on deposit beta (remember, beta is how much interest bearing deposits increase as a fraction of Fed Funds rate) guidance of 0.42 by year end (I used 0.39 as the average for the year), a Fed Funds rate peaking at 5.5% and an average of 25% non-interest bearing deposits (NIBs).

The resulting earnings look pretty good.  Up 10% YoY.

So why is the stock only $124? Why does it trade at a 7.9x PE?

The two things that come to mind are:

  1. the market is pricing in much bigger earnings hit, presumably by rising deposit costs.
  2. the market is pricing in big defaults

Let’s look at deposits.  What happens to PNC earnings when deposit costs go up a lot?

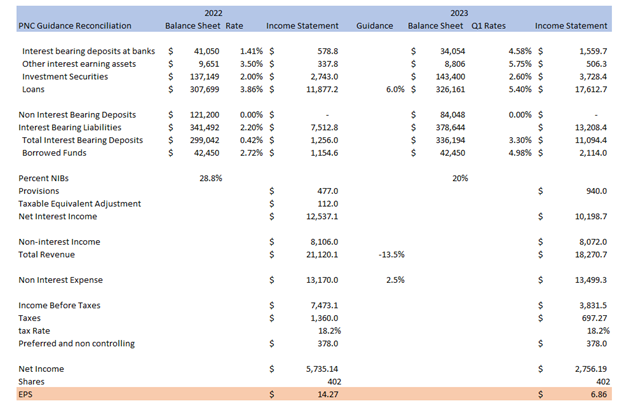
Below is PNC with a deposit beta of 60% (instead of 39%) and with non-interest bearing deposits dropping to only 20% of total deposits (instead of 25%).

It has a large impact on earnings. But even with an extreme assumption, it is no death blow. It puts PNC at an 18x PE.

Moreover, this assumption seems quite extreme. Deposit betas of 60% would mean the average rate for PNC’s interest bearing deposits would go to 3.3%. In Q1 it was 1.66%. That’s a huge jump. Is that really realistic?

I doubt it.

What I see right now are two worlds. There are banks paying high deposit rates and banks paying low deposit rates. PNC is, of course, in the latter group. Here is where the banks in my watchlist sit so far:

The other possibility is that the market is worried about credit losses. Which is always the great unknown for a bank.

PNC gave a lot of information about potential credit losses in their Q1 report.

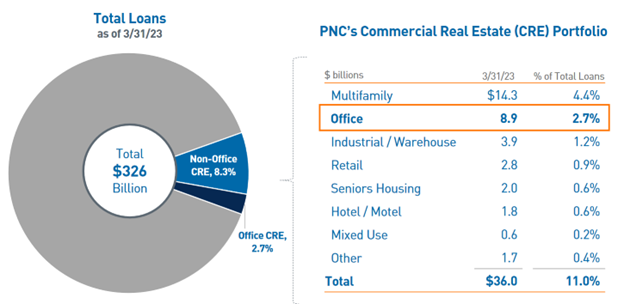
The biggest worry with loans comes from commercial real estate. Within the CRE bucket the biggest worry is office.  Office makes up $8.9 billion of PNC’s loans – or 2.7% of total loans.

Of course, while office is not a lot of the whole, $8.9 billion is still a lot.  But those office loans have a lot of buffer. 

PNC gave a very detailed summary of their loan origination practices on the call:

Reserves against these loans, which we have built over several quarters, now totaled 7.1%, a level that we believe adequately covers expected losses. In regard to our underwriting approach, we adhere to conservative standards, focus on attractive markets and work with experienced, well-capitalized sponsors. The office portfolio was originated with an approximate loan to value of 55% to 60%, and a significant majority of those properties are defined as Class A.

 We have a highly experienced team that is reviewing each asset in the portfolio to set appropriate action plans and test reserve adequacy. We don’t solely rely on third-party appraisals, which will naturally be slow to adjust to the rapidly shifting market conditions. Rather, we are stress testing property performance to set realistic expectations. To appropriately sensitize our portfolio, we’ve significantly discounted net operating income levels and property values across the entire office book. Additionally, tenant retention, build-out costs and concession levels are all updated to accurately reflect market conditions.

 Credit quality in our office portfolio remains strong today with only 0.2% of loans delinquent, 3.5% nonperforming and a net charge-off rate of 47 basis points over the last 12 months. Along those lines, we continue to see solid performance within the single tenant, medical and government loans, which represent 40% of our total office portfolio. These have occupancy levels above 90% and (inaudible) levels of 3% or less. Where we do see increasing stress and a rising level of criticized assets, is in our multi-tenant loans, which represents 58% of our office portfolio. Multi-tenant loans are currently running in the mid-70% occupancy range. (inaudible) levels are greater than 30% and 60% of the portfolio is scheduled to mature by the end of 2024.

 In the near term, this is our primary concern area as it relates to expected losses and by extension, comprises the largest portion of our office reserves. Multi-tenant reserves on a stand-alone basis are 9.4%. Obviously, we’ll continue to monitor and review our assumptions to ensure they reflect real-time market conditions.

The key points here are:

  1. They’ve already reserved 7% on these loans
  2. Loan to value is 55% to 60% on these loans
  3. They have already significantly discounted net operating income levels and property values
  4. Right now there are 0.2% delinquent, 3.5% non-performing
  5. 40% of the portfolio is single tenant, medical and government loans

I sat on this post for the last day thinking about what else could go wrong. I mean, there is always the possibility of a 2008 style liquidity squeeze, and of course if that happens, all bets are off on the stock.

But absent something truly systemic, I just can’t see why the stock would have another leg down. And if it doesn’t go down, it should eventually go up.

So we’ll see. I’m quite interested to see how this plays out. As much to see what I may have missed as to see if I’m right.