Skip to content

Posts from the ‘Uncategorized’ Category

Falling Knives in the S&P

The S&P index is down about 6% and the Nasdaq about 8%.  By these measures, thus far it has been a correction but not a steep one.

But it doesn’t feel like these moves in the indexes tell the whole story.

You get a bit better sense of how the market has been performing by seeing the larger swath of small-cap companies included in the Russell 2000 index, which is down 11% from its high in late July.

There are some individual situations that are much worse.

This weekend I went through the individual stock charts of all the S&P names looking at what has really been crushed.  The knives that have fallen the most.  On Twitter I made the following comment:

The funny thing about the above portfolio is how diversified it is. You have growth, defensives, cyclicals, healthcare. There is not a lot in common between the sectors that have performed the worst.

Maybe what is in common is who owns them? @CorneliaLake, a very smart guy who would have much more knowledge into this than I have, responded to my tweet with:

So maybe that explains it to some degree?

My history with catching a falling knife is good and bad.  I’ve had some good luck with it recently – in December I bought a lot of SaaS stocks that were going down every day.  Before that I bought Meta when it fell to the 80s and Amazon when it fell to the 90s.

Other the other hand, there have been plenty of cases where it hasn’t worked.

Here are some knives that have fallen a lot. 

Solar

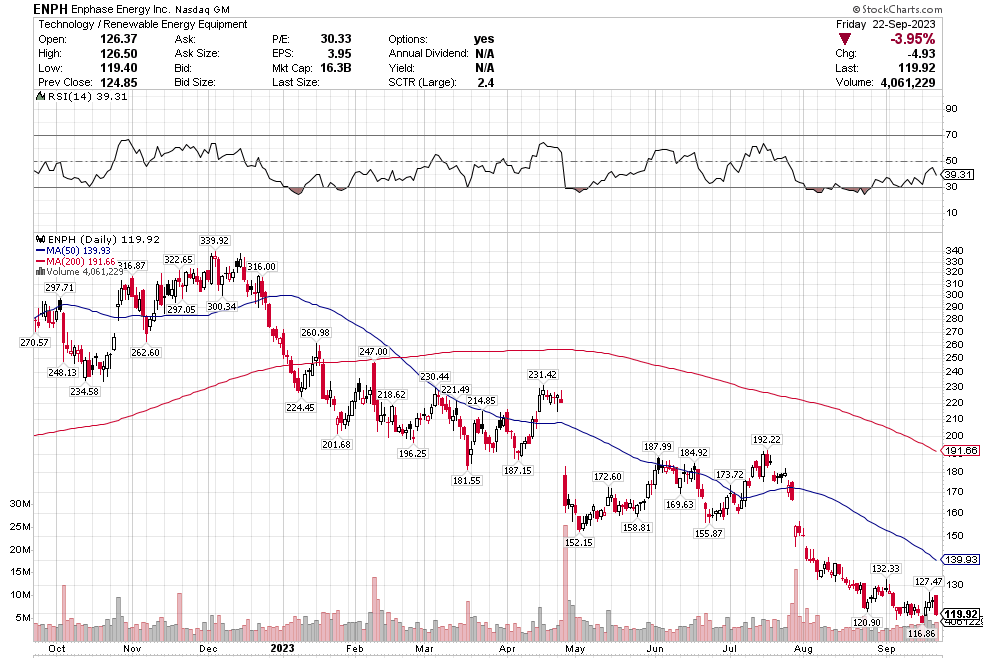
Some of these solar stocks have just gotten killed.  I have read that the residential solar market in the US and Europe is slow and that because demand was so strong last year, the market over-ordered and that has caused an inventory glut.  That is why Enphase and SolarEdge are down.  Tesla is also making more of a push into solar, which adds another formidable competitor.

I’m less certain why First Solar is down, since they sell into the utility solar market and that has been okay from what I have read. 

On the positive side, the longer-term demand picture for solar remains intact and underlying demand, especially in Europe, continues.  Solar also benefits from higher energy prices, which are beginning to happen again.

Dollar Stores

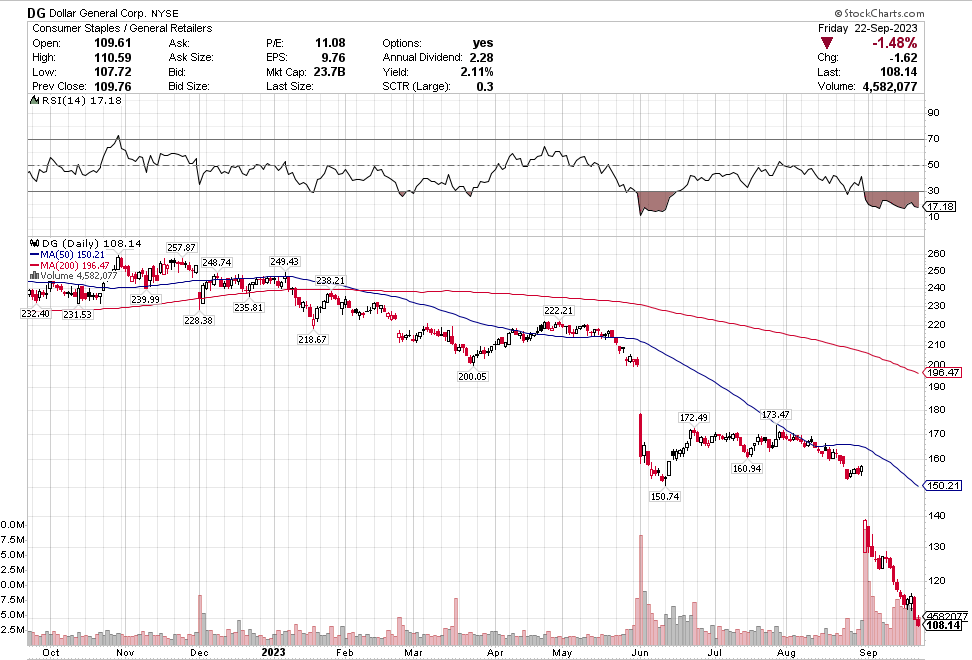
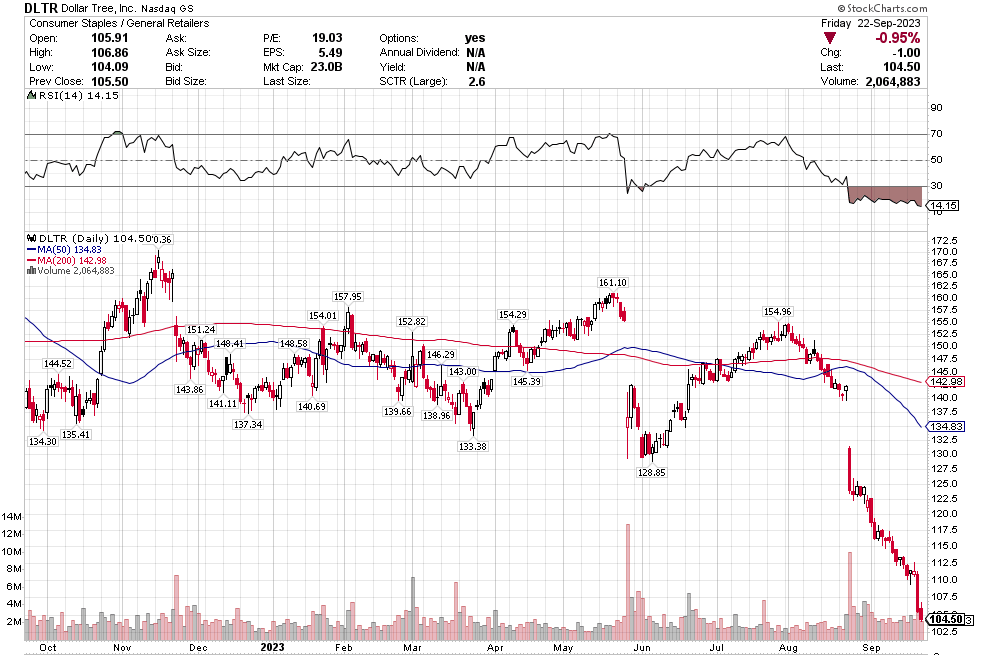
The dollar stores have been crushed.  I have looked at Dollar Tree but not Dollar General.  It appears that what started it all for Dollar Tree was when they raised revenue guidance for Q3 but did not raise earnings guidance.  Of course that meant that margins were under pressure, which crushed the stock.  I assume the same is true for Dollar General.

Today, these stocks are cheaper than they have been in at least 10 years.  Dollar Tree buys back a lot of stock, they reduced their share count by almost 100mm shares (over 30%) the last 10 years.  Dollar Tree has traded in a range of 1.1x EV/sales to 1.5x EV/sales over the last 10 years.  Today its at under 0.8x.    One odd thing about these dollar stores is that the Canadian comp, called Dollarama, is just off its 52 week highs!
Airlines

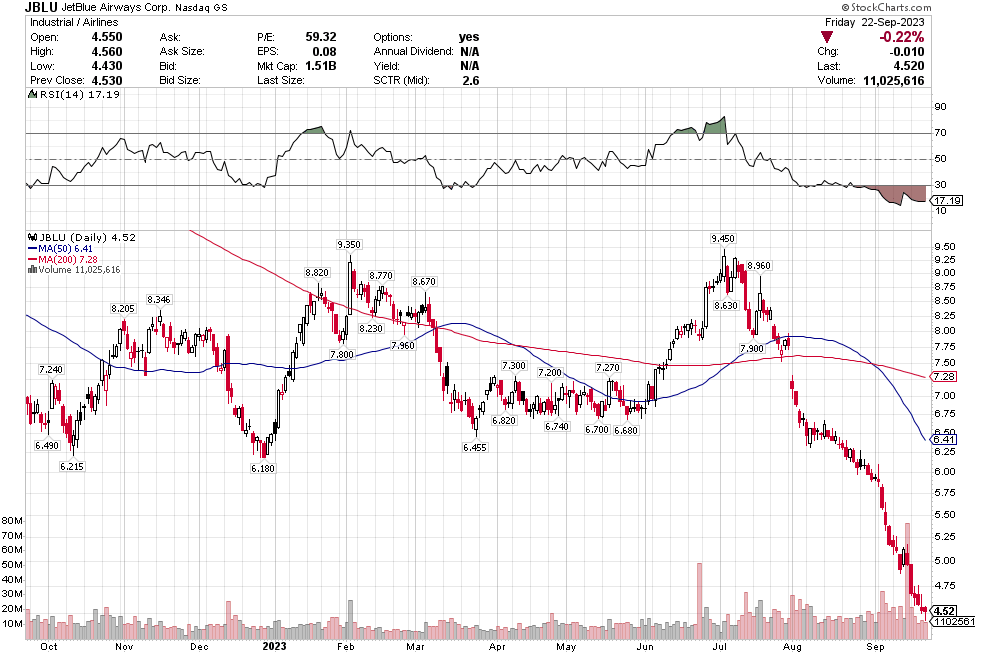
I already wrote about Air Canada last week.  It has continued to go down.  It is not the only one.   The entire airline complex has been in free fall.  Yet I read a piece from Wedbush this week that said air travel (and more generally travel) demand is slowing from the summer heights, but still holding up just fine. 
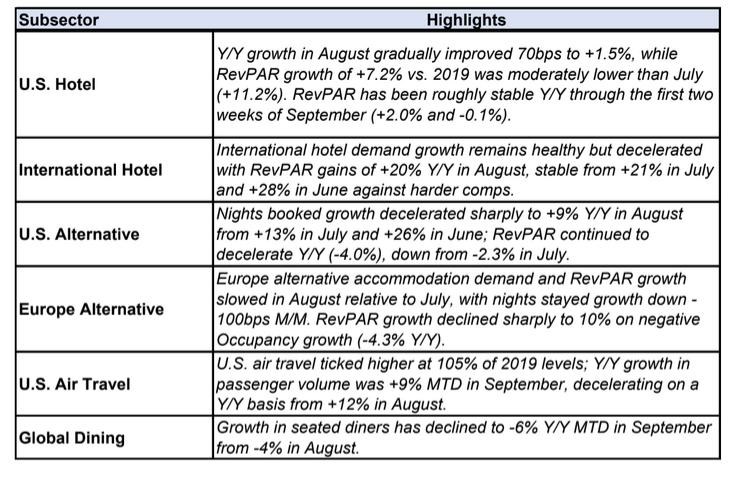
The airline stocks are trading like a massive recession is upon us.  Even stalled out oil prices hasn’t seemed to helped.

Medical Devices

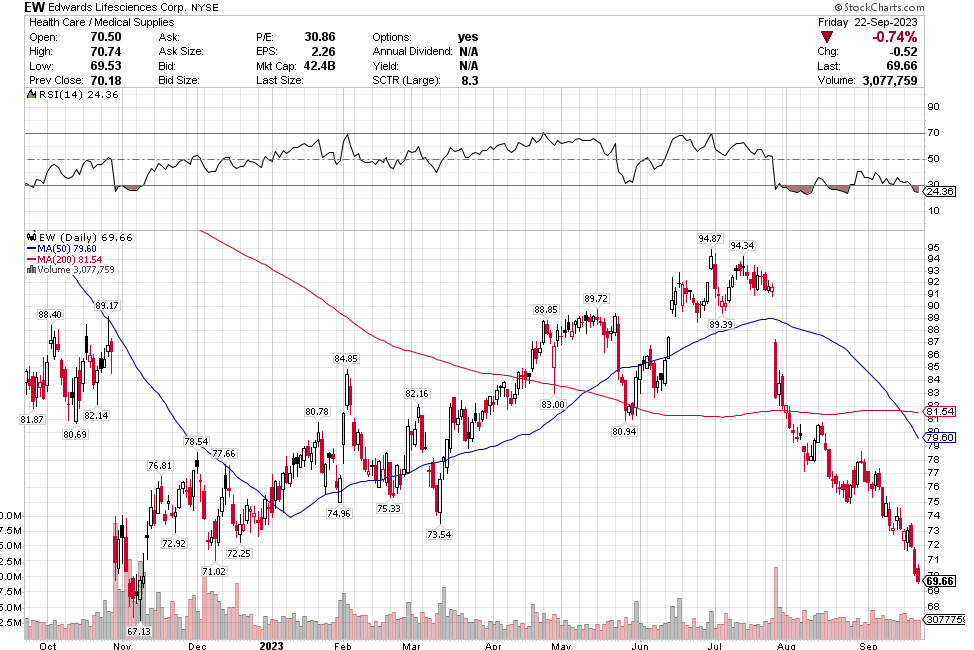
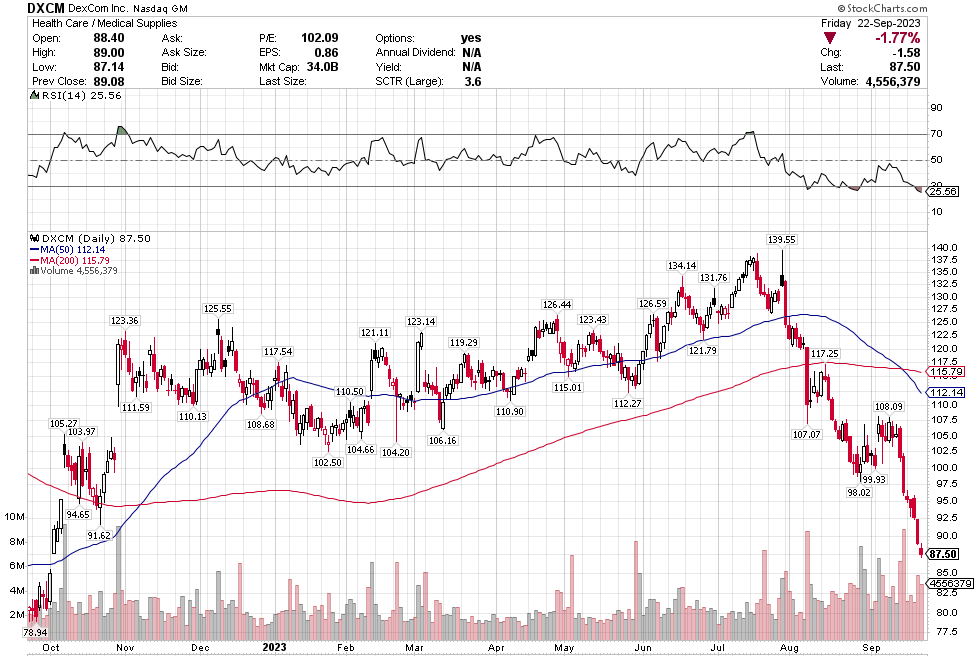
One of the surprises when I went through the list of S&P companies was the number of medical device stocks that were just in free-fall.  Edwards Life Sciences, Dexcom, Resmed and Teleflex are all disasters.

These companies are all growing the top line.  They are profitable.  Yet they are down near or even past their COVID lows.

It took me a while to figure it out.  It all has to do with Ozempic and the weight loss drugs.   Some of these are obvious – for example Dexcom is glucose monitoring for diabetes.  Some are less obvious – for example it turns out Resmed makes money from sleep apnea therapy and sleep apnea is more prevalent in obese people.  Who knew?  Of all the names Teleflex looks most interesting because they are pretty cheap on earnings and I’m also not really sure how Teleflex is related to Ozempic, which makes me wonder if it is being caught in the downdraft.
Staples

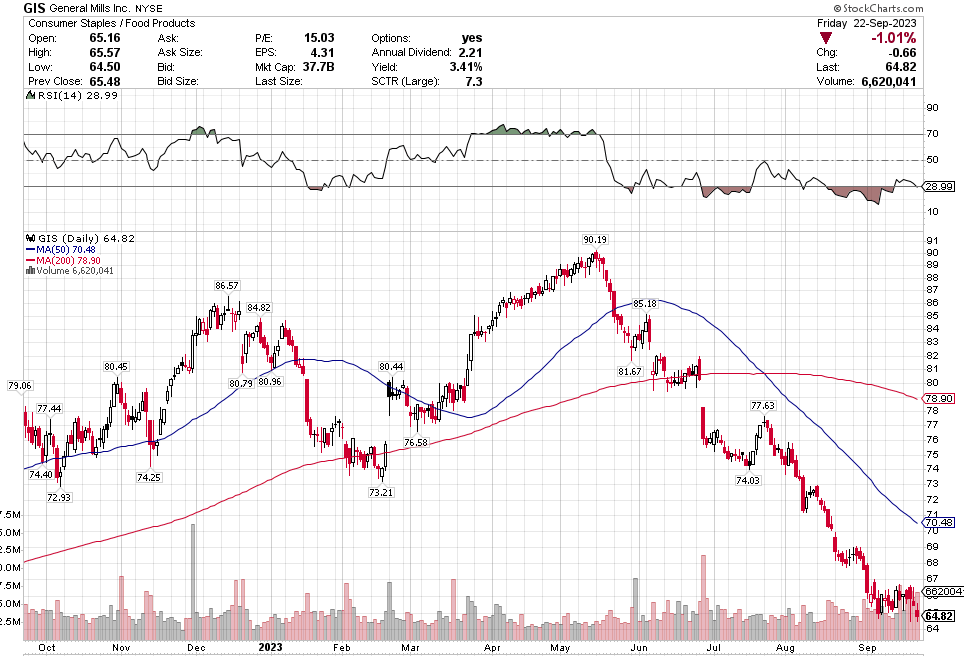
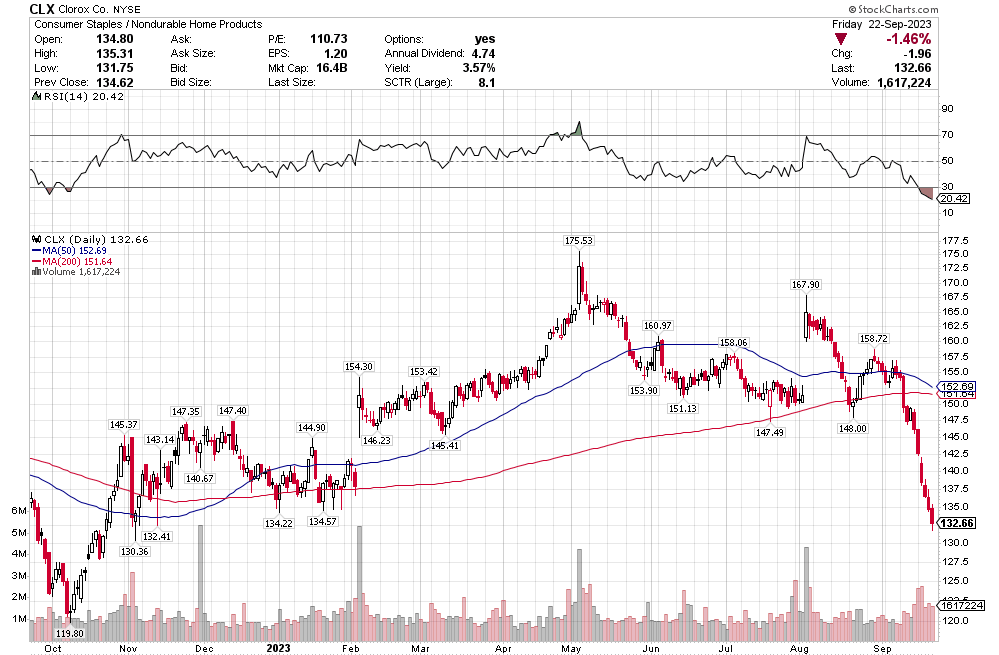
Some (but not all) staples, like General Mills, Clorox, Hershey, McCormick & Company and Kimberley Clark have been hit pretty hard.  Some of this is again due to the weight loss drugs – like Hershey for example and probably General Mills. 

Some of this is likely just because these companies are really expensive and with interest rates rising some of their multiples are coming down.  These are names I have been paying attention to because I was actually right about a few of these – I was short both Kimberley Clark and Clorox.

I think General Mills is worth a closer look.  I haven’t spent a ton of time on it yet but reading through their quarterly results, which they released just this week, and it seemed ok.  They reiterated guidance, are going to grow 3-4%, grow earnings and FCF 4-6%.  The stock trades at 14x PE with a 7.5% FCF yield which actually seems reasonable to me.  It is a whole lot cheaper than some of the staples I was looking at last year, when they seemed to all trade at 30x earnings.
Hardware Stores

These are more recent victims.  Lowes and Home Depot have done very poorly over the last couple weeks though both are still up on the year.  It is probably too soon to be thinking about these stocks but at some point they would be interesting.  It looks like HD trades at about 20x PE and LOW at 15x, so these are crazy cheap but not crazy expensive either.

REITs

The REITs are pretty ugly looking in general, which I guess isn’t surprising with rates so high.  Nevertheless, I am a little surprised that names on the apartment REIT side, like Mid-America Apartment Communities, is doing as badly as it is.  Maybe I am biased from living in Canada where it seems like housing shortages are on the front page.  This is another weird one where the Canada comp seems to be opposite.    When I look at Boardwalk, an apartment rental company here in Canada, the chart is at its highs.

Casinos

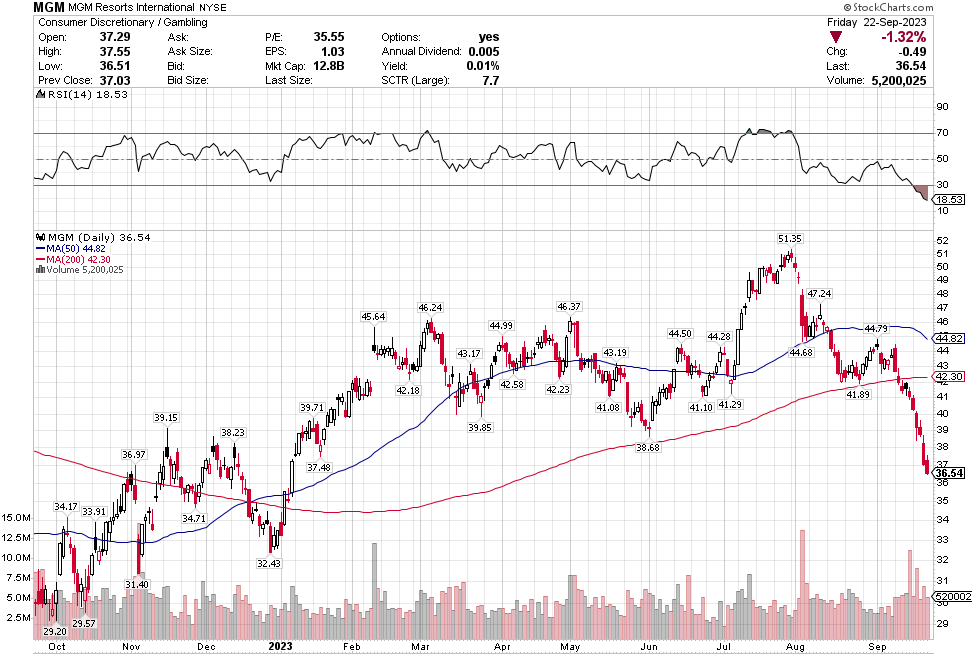
Las Vegas Sands and MGM are in freefall right now.
Advertising

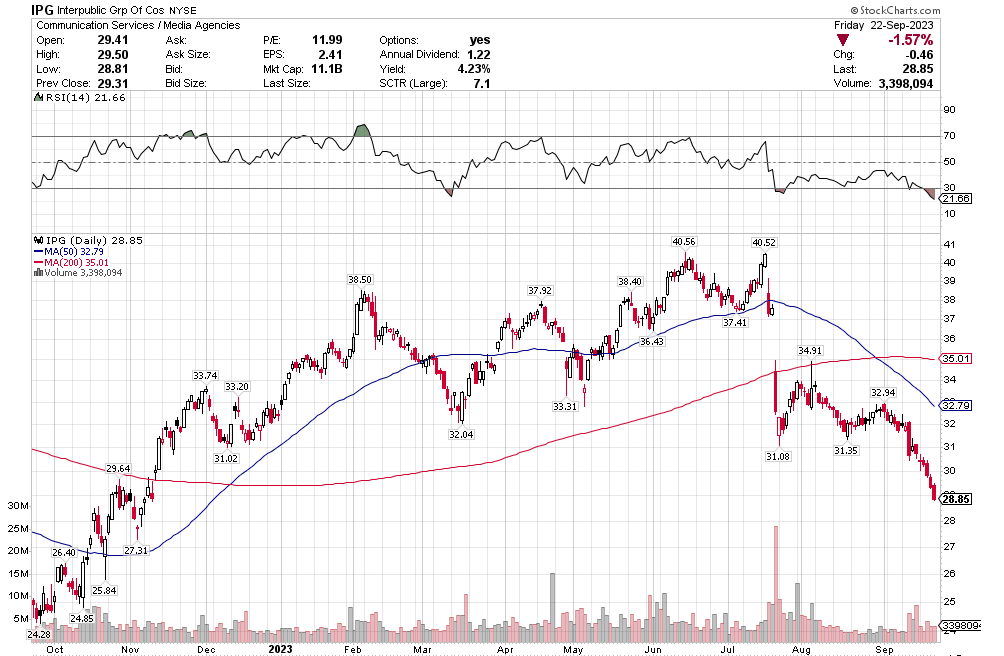
I don’t know a lot about this sector but I plan to learn more.   Interpublic Group and Omnicom both provide advertising and marketing services.  Both of these companies are trading at 10% FCF yields and under 10x PE which makes them interesting.
Those are the sectors that I see performing the worst of late.  Maybe most encouraging is that other than these sectors, most stocks in the S&P seem to be holding up okay.  I did not see any wide spread collapses.   Some of the charts look a little rough because of the sell-off Thursday but we’ll have to see if there is any more follow through.

What to do with Air Canada

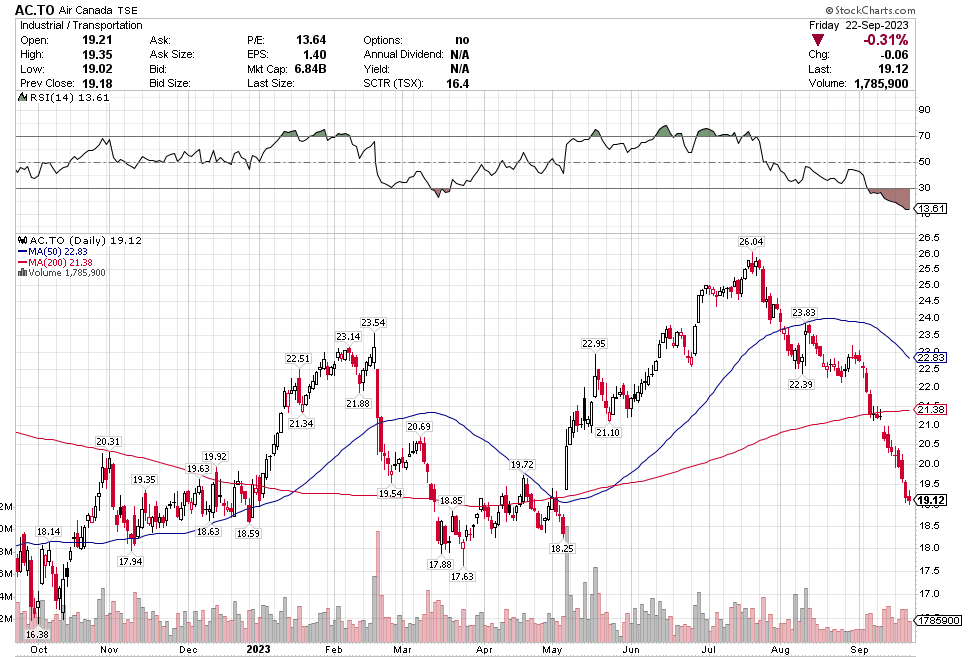
Air Canada has gotten whacked since it released its Q2 results.  The stock popped on the day of the results and has fallen since.

I took a small position in the stock at $22.50, when it dipped after a good earnings report.  I thought: it was a good quarter, they guided well for Q3, the economy continues to do okay, they are hedged for fuel, and the stock is pretty oversold.

That reasoning has not turned out very well.  The stock has continued down, all the way back to $20 and now we are really, really oversold.  My loss is at that 10% level where I usually revaluate and often admit defeat.

Q2 WAS GOOD

Air Canada had a very good second quarter.   Revenue was up 36% YoY and they had $1.2b of aEBITDA, which is an aEBITDA margin of 22.5%.  FCF for the quarter was $965mm which is up $537mm from 2022.  They raised the low end of  their FY EBITDA guidance.

Air Canada said that their international segment was really strong, up 70% YoY.  US transborder was up 26%.  Domestic Canada revenue was up 15%.  The only real down business was cargo.

They said that “based on current passenger booking patterns, we see prevailing strength in travel demand over the second half of 2023, giving us confidence to increase the lower end of our adjusted EBITDA guidance range”.

PILOT SHORTAGES

They slightly reduced their average seat miles capacity and decreased their average cost per available seat mile guidance for the full year.

It sounds like the reduction in ASM is due to pilot shortages and planes that are taking longer to put back into service.  In fact, at the end of August they removed routes out of Calgary to Ottawa, Halifax, Los Angeles, Honolulu, Cancun, Frankfurt because of the shortage.

Pilots are also an issue for Air Canada because their contract agreement is up next year.  WestJet pilots and some of the american airline pilots got large raises this year.

FUEL COSTS

All the airlines are getting hit because of fuel costs.  Spirit and American both warned this week with Spirit raising their fuel cost estimate from $2.80/g to $3.06/g and AAL raising their from $2.60/g to $2.95/g.  US$3/g works out to about C$1.08/litre.

Air Canada was pretty smart about fuel prices.  They are one of the few to hedge out some fuel costs for Q3. 

That works out to about 79c per litre in Canadian dollars.  Which is well below current jet fuel costs.  Their guidance for the FY calls for C$1.08 per litre assuming a $1.34 US dollar. 

In Q2 Air Canada’s fuel cost was $1.01 per litre vs $1.47 per litre in Q2 2022.  Just looking at roughly the impact, Air Canada used 1,162b liters of jet fuel in Q2.  A 10c move in jet fuel would be about $110mm more costs per quarter.  EBITDA was $1,220mm in Q2.   So big moves in jet fuel can certainly impact results.

I think its fair to say that Air Canada’s Q3 results aren’t going to be impacted by fuel costs like the other airlines because of the hedge.  But post-Q3 their costs will be hit if prices stay this high.

PROFITABILITY

Air Canada margins have improved a lot since before the pandemic.  Gross margins in Q2 were 14.8% vs 8.8% in Q2 2019 and 7.1% in Q2 2018.

In what is kind of an amazing flip from when I liked the stock in the 2015-2018 period, Air Canada actually has better margins than its peers:

That has led to this higher profitability.  Air Canada’s available seat miles (ASM) was 24,606 in Q2 2023.  This was about 3,000 seat miles less than 2018/19.   But the company still generated significantly more EBITDA and cash flow than both those years.

Air Canada has a lower market cap today but more debt (which is a carryover from COVID).  Net debt is $5.3b vs 2019 net debt of $3.3b.  The overall enterprise is still about $4b lower than it was in 2019.

They are actively reducing debt – they announced $589mm of repayments just last week.

Here is the big question – should it be cheaper today than 2019?  Yes, there are headwinds on fuel and pilots.  But margins are better.  Growth into 2024 looks better.  Competition in Canada looks more favorable.

If Air Canada can maintain margins and continue to add capacity (they are calling for a normalization of their capacity to 2019 levels by 2024), I think you can make the argument that the discount is not warranted.

To get the same enterprise value as the end of 2019, Air Canada would need a $32 share price.  That is $12 more than the price today and a 60% return.

Of course the case to be made against Air Canada is that margins aren’t going to stay at this level and Air Canada is fairly valued versus where comps are today.  The table I made above showing them and other airline multiples is from RBC.  The stock trades at average multiples on 2024 estimates – 5.1x EV/EBITDA.

But RBC is pretty bearish on 2024.  They are estimating $3.27b EBITDA in 2024 vs. Air Canada’s guide of $3.5b to $4b.

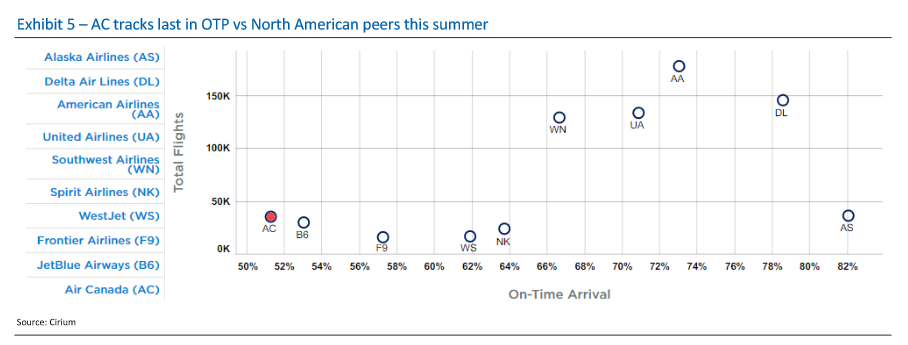
Another strike against Air Canada is that is has been pretty crappy to fly on.  It does not have the best consumer metrics, in fact on some measurements it has some of the worst consumer metrics, which is a strike or two against it.

On the other hand, I really kind of wonder how much it matters.  Air Canada and WestJet basically have a duopoly in Canada.  I see that first hand, and I suspect that they have used COVID to come to a mutually beneficial (unspoken) arrangement in that duopoly, with WestJet dropping eastern routes and Air Canada dropping western routes.

That could be why their margins are now as strong as Delta and American, and better than United, Southwest and Jet Blue.  In Q2 margins were higher than they have ever been for that quarter.

They are in a weird spot.  Air Canada has record high demand, loads and fare giving them record margins and loads of cash flow.   The argument that RBC is making is  that this is as good as it gets – but to what stock price?  The stock needs to get well into the $30s  to get to 2019 levels and that is a time with lower margins.

They were at the Morgan Stanley conference last week, which would have been the opportunity to warn on fuel if they were going to do so.  They didn’t.

Also factor in that because of the extremely strong cash flow Air Canada should be able to reduce debt by another $2 billion by year-end 2024 – which if you add that to the stock price is another $5.50 per share.  Air Canada produced $965 million of FCF in Q2 and $1.95b of FCF in the first half of the year (though much of this was changes in working capital).

Honestly, I don’t know what to do about this one.  Hold or give up.   I can see reasons both sides.   Sometimes decisions aren’t cut and dry.

Star Bulk Carriers

I need to come up with a way to get my writing out on this blog more regularly. I haven’t posted in a while but that doesn’t mean I haven’t been researching and writing. I have. I have posts on Air Canada, Blue Bird, Crocs, UIPath, PagerDuty, Snowflake, HBT Financial, Innovative Solutions and a few others. I just keep getting this uncomfortable feeling about all the emails that get sent out when I put them on the blog.

To try to get past that, I deleted about 400 subscribers that I have again accumulated over the past 4-5 years, when I last did a purge. There is only about 40-50 left and I think I know pretty much all of those names in some way.

So hopefully that is going to help me get over this stage-fright and put up some of the stuff I’ve written. I’ll try to stagger it out.

This post is about Star Bulk Carriers, which I don’t own, but am thinking I will own some time soon.

What I wanted to do here is see whether this company is cheap at this level. I have begun to convince myself that it is.

First lets go through the numbers.

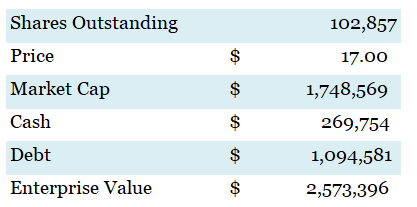
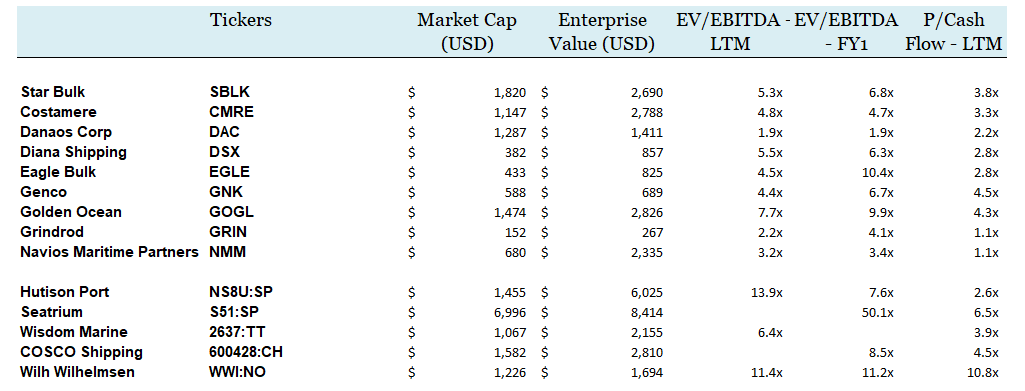
Right now SBLK trades at 9.7x P/E and 6.8x forward 2023 EV/EBITDA.  All these dry bulk stocks trade quite cheaply on TTM cash flow:

WHAT ABOUT Q2 RESULTS

SBLK earned 47c EPS in Q223.  They paid out a dividend of 40c for the quarter.  They have a variable dividend that follows their earnings closely. This means that you can’t count on that dividend, it is more of a bonus.

SBLK also bought back 307k shares in Q2 – that’s a buyback rate of 1% of outstanding per year. If you go back through the last few years the share count has risen, not fallen, so while they are buying back stock, it isn’t offsetting dilution.

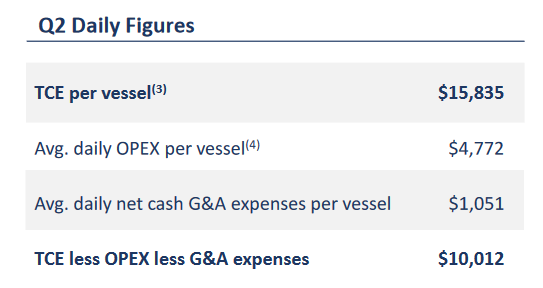
TCE for the quarter was $15,835 per vessel per day. This has come down A LOT from the highs of a few years ago. We are pretty close to historic levels now, which is one of the reasons I’m thinking about the stock:

SBLK has definitely been paying down debt and raising cash the last couple of years. They aren’t really levered at all, which was always a knock against these shipping companies.

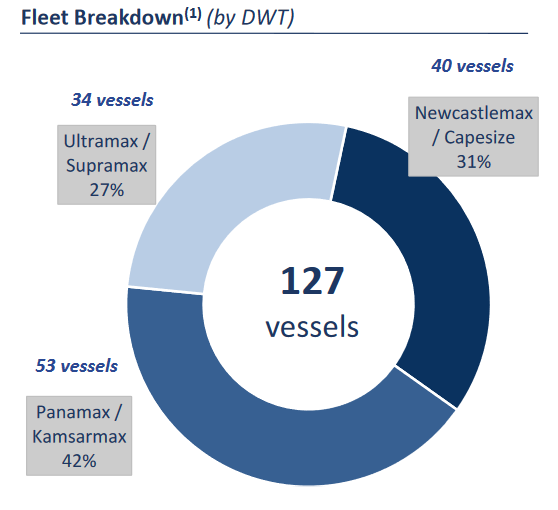
SBLK owns 120 ships with total tonnes of 13,347,973 DWT.  This is the largest fleet among US and EU peers. They own a pretty even breakdown of the big, bigger and biggest dry bulks ships:

They have another 6 new builds coming in 2024.  4 are Kamsarmax and 2 are Ultramax.

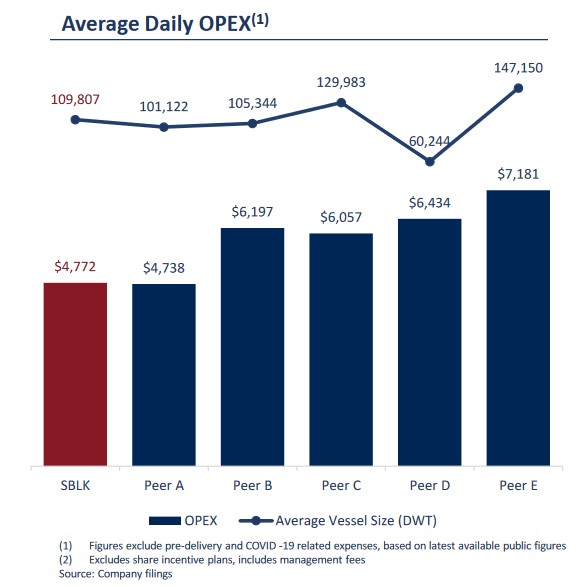
From everything I have read, Star Bulk is one of the best operators. They have some of the lowest costs in the industry (I have a chart on that at the end). They haven’t done anything particularly stupid like some of these shipping companies are prone to do. They just are what they are – a shipping company that moves with the dry bulk market.

WHAT ABOUT DRY BULK SUPPLY/DEMAND

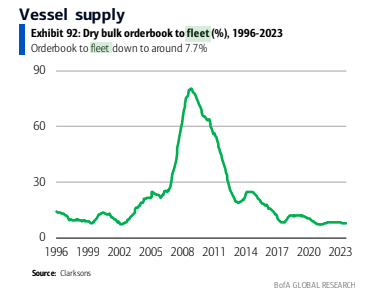
According to Star Bulk the order book is low:

Looking back historically, that is about as low as it goes.

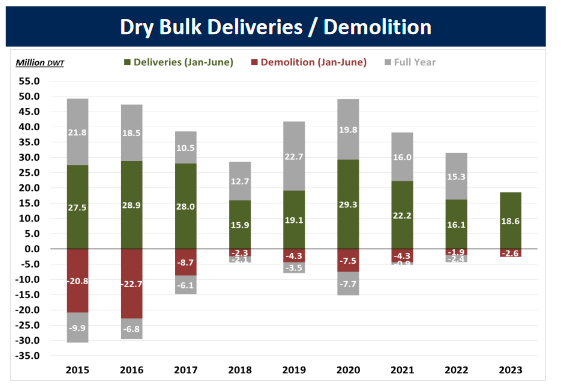
The order book also doesn’t look too bad to me.  It is just about as low as it has been and it is down YoY for the first 6m

The delivery numbers don’t look too bad but the demolition numbers are low:

Fleet growth is expected to be pretty muted for the next couple of years.  Only abought 1% for 2024 and 2025.

Here are some industry comments from Twitter:

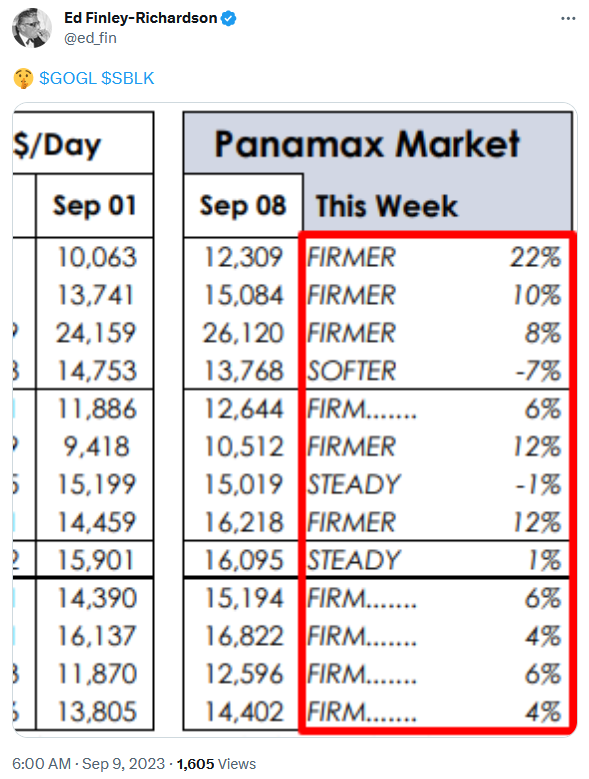
First this. There is some evidence that dry bulk rates are bottoming and firming up.

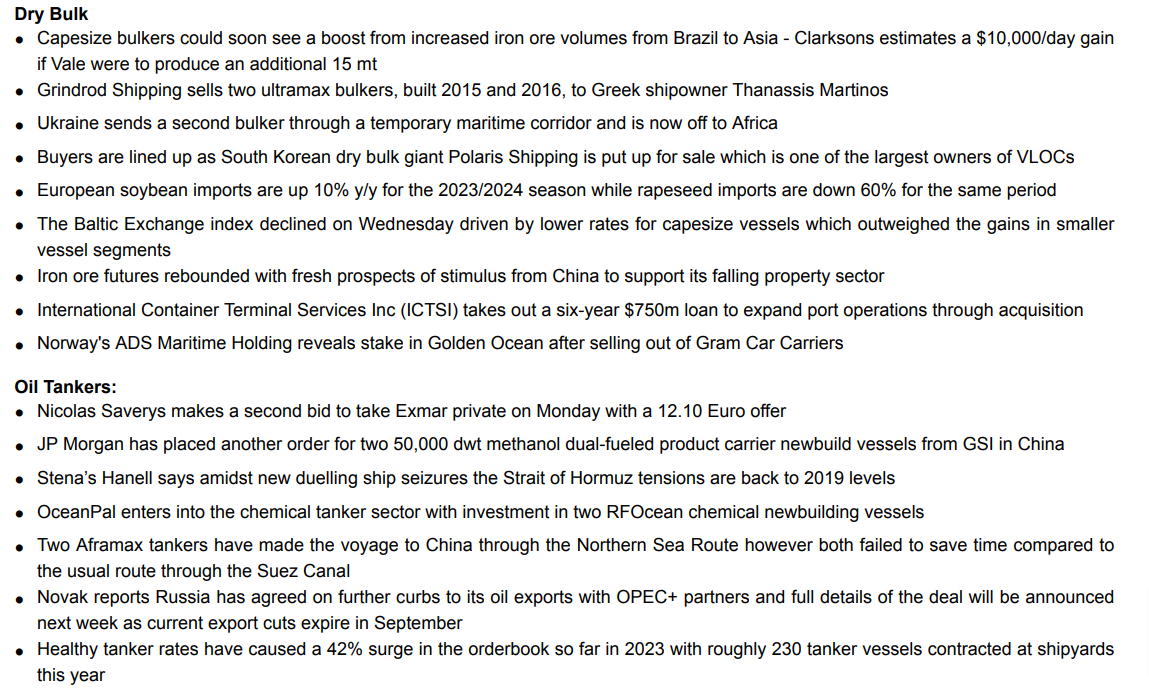
These are some thoughts on the market from Stifel.  There isn’t really too much here other than that iron ore volumes could increase:

Stifel has a pretty strong rate outlook. if their base case plays out SBLK almost has to go higher.

VALUATION

Star Bulk has an NAV of $20 based on current vessel values.  The stock has pretty consistently traded at between flat to a 30% discount to NAV.  It is about a 14% discount right now.   But also consider that this is off an NAV that is quite a bit lower than it has been even 6 months ago.

You could make the argument that on P/NAV SBLK is expensive compared to comps like GNK and EGLE.  Both of these stocks are trading at more like a 30% discount. But SBLK is also out-earnings those companies.   As I mentioned earlier, SBLK has some of the lowest OPEX in the industry. So they get more out of their ships than their peers.

Also playing to the “out-earning” idea, they aren’t comparatively expensive on operating metrics.

What are the risks?  In the short-term, I think it is mainly global growth.  A deep recession would hit them of course.  China needs to pull out of its funk.

Over the longer term I have to think coal demand is a risk.  But I don’t know if that is worth considering as a trade idea for the next 6-18 months.  I’ve screwed myself enough ignoring oil because of my longer term worries.

But absent a big recession, I don’t think a big decline in rates is a risk any more.  Rates have mostly done a round trip.

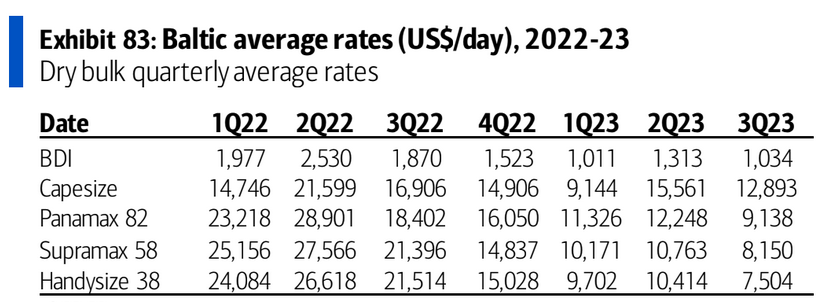
In Q2 SBLK had an average Time Charter Equivalent rate of $15.8k per vessel.  In 2019 they did $13k and in 2018 $13.8k.  Looking at the table below, rates were 2x to 4x current levels at the peak, depending on the ship (note that these are spot monthly rates, which are lower than the 1-year charter rates that are in the other charts/tables).

The stock itself is not all that different than it was before Covid.  The price (unadjusted for dividends) today is $17.50 vs $12 at YE 2019:

Since that time, net debt has declined by $450 million.  So really the difference in total enterprise value today is about $100mm, or a buck a share.

There are lots of ways to think about that comparison.  A few are:

  • SBLK had no FCF yield in 2019 vs. a 30-40% FCF yield today
  • SBLK paid a 5c dividend in 2019 vs. a $1.90 dividend today
  • Second hand vessel prices are about 50% higher today than they were then

CONCLUSION

This isn’t a blow your socks off kind of idea.  It is also probably not an immediate buy.  SBLK could easily go back into the $16s in the next few weeks or months if the market doesn’t leg higher.

And look, there is no getting around that the whole idea hinges on the economy not deteriorating significantly.  You can’t deny that risk.  The bulkers are screwed if we get a global recession.

But if we aren’t going to have a significant recession it just seems like this stock is likely bottoming at this level.  And with the fleet growth muted and interest rates high to deter new entrants, there are some levers to make me think a cycle up could come quite quickly.

Is Bank7 a Compounder?

Bank7 got hit in March, along with the rest of the banking sector, but it never really traded down close to its 52-week lows.  It corrected, but the move in the stock looked more like volatility than any real secular change.

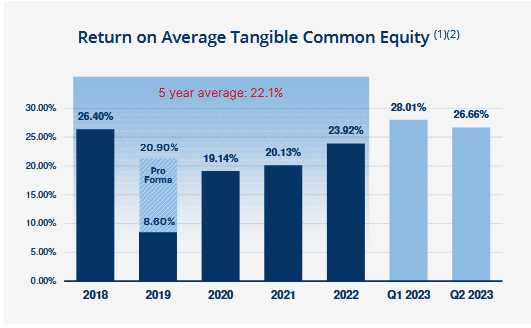
That is probably for good reason.  Essentially it comes down to this.  For the last 5 years Bank7 has been averaging 22.1% return on tangible common equity.  Those returns even accelerated in Q1 and Q2 of this year.

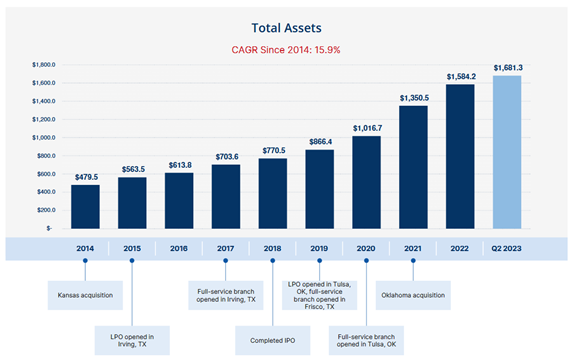
Since 2014 Bank7 has grown assets at a 15.9% CAGR.  Most of that organically, as this has only included a couple of acquisitions.

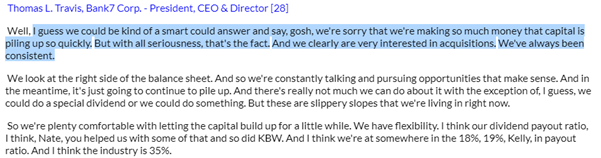
Bank7 managed through COVID and now through inflation and they just keep growing. That has left them with a nice problem, which they articulated on the last conference call:

In the current moment of high interest rates and a (surprisingly) strong economy, Bank7 fits my criteria of a bank that should do well.  They are heavily weighted to the loan side (as opposed to securities), to variable rate loans, to the type of loans that will hold up better in a good economy, and the loans they are making are at 8%+ rates.

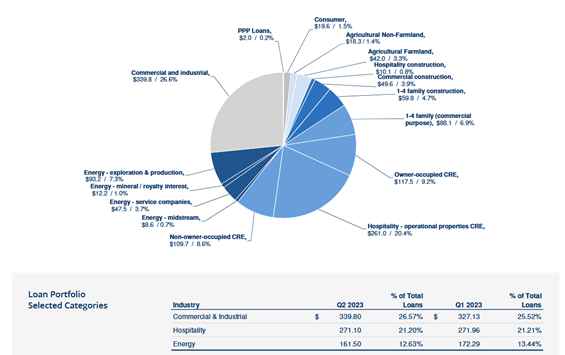
Of course all this means the loans that Bank7 makes are riskier than most.  There is quite a bit of energy and quite a bit of hospitality CRE in their portfolio.  In a bad economic environment those could cause trouble.

But for now, apart from one outlying energy credit that is going through bankruptcy (and that BSVN expects to recover fully on) their loan book seems to be performing fine.

There’s one large credit, I think that’s out there in the public realm that we really can’t talk about because there’s ongoing litigation. Outside of that line of credit, the energy book is performing very well. I will say that the deal flow there has slowed quite a bit from the pace of last year, and we did contract about. It’s about $10 million during the quarter. I wouldn’t be surprised if there’s a little more contraction as the year goes on in that book, but overall, credit quality there is very strong with primarily companies we bank for a long time.

Bank7 Q2 earnings were one of the few bank earnings reports that showed minimal deterioration to the bottom line. Even though they did have a noticeable rise in deposit costs earnings were flat.  Bank7 had $1.06 EPS in Q2, essentially the same as Q1.  At this run-rate they are trading at 6x P/E.

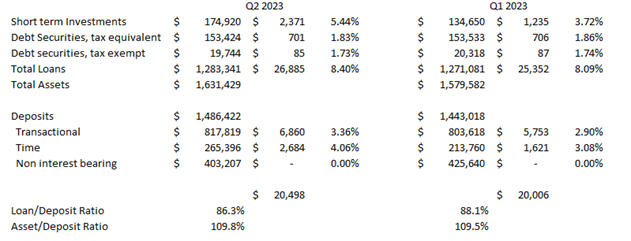
I found it interesting to walk through Bank7’s interest income numbers in Q2. It kind of highlights how a bank can avoid earnings compression even as its deposit costs rise.

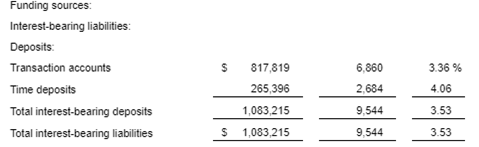
In Q2 Bank7’s deposit costs rose quite a bit.  They were far from immune to the repricing of deposits. Their total cost of interest bearing deposits in Q2 was 3.53%.  This was up from 2.94% in Q1. 

Just purely on cost of deposits Bank7 lost nearly 60 bps of margin.  On the surface that would seem a bit worrisome. It had to cut into the bottom line right?

Not so much.

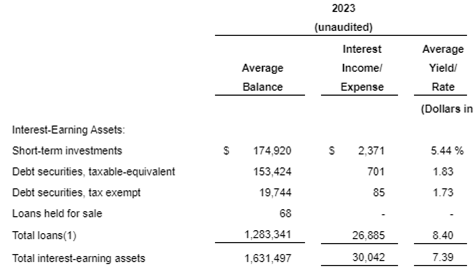
This was, in part, because Bank7’s loans re-rated upwards as well.  Their average yield on loans is now 8.4%.  That was up from 8.09% in Q1, so up 31 bps.

That loan book repricing is because of variable rate loans. A couple of quarters ago Bank7 put out a slide on their loan book.  Three quarters of their loans were variable rate.  Some of these loans are hitting a ceiling now though, so I think that going forward the variable-ness of their loan portfolio is less, closer to 50%.  But up until now, Bank7 has seen their loan book reprice along with their deposits.

So the loan book re-rating up helps explain why earnings didn’t decline. But it doesn’t explain it entirely.  Even with the re-rating of the loan book Bank7’s deposit costs rose a lot more then their loans.  Subtracting the interest rate of what Bank7 paid for all its liabilities from the interest rate it got from its assets, you get a spread of 3.85%.  This is down 25 bps from Q1 so better than the 60 bps they lost on deposit costs but still not insignificant.

But their actual net interest margin was down only 10 bps from Q1 to Q2.  It was 5.04% in Q2 vs 5.14% in Q1.   And their net interest income, the dollar amount of net interest they received, was actually up from the first quarter (which is what really matters for earnings).

What sort of black magic is this?  How does Bank7 go from losing 25 bps on interest costs to only 10 bps on net interest margin to actually gaining on net interest income?

I talked in prior posts about how well-managed banks can manage their earnings and often they have more levers to pull than they are given credit for.  With Bank7 it wasn’t so much lever pulling as them setting themselves up with assets and deposits that match in terms of their interest rate sensitivity, so that even when a portion of those liabilities (the interest bearing deposits) was rocketing higher their bottom line was insulated.

When you look at the interest income breakdown for Q1 and Q2, it really comes down to two things.

First, Bank7’s short-term investments, which is really just their own cash that is held at the Federal Reserve banks, yielded more.  They also added to the cash pile by $40mm, which was offset by deposit adds of about the same.  This had some impact on the net interest income number.

Second is the “magic” of non-interest bearing deposits.  Yes, Bank7 saw the cost of their transactional and time deposit costs rise a lot.  But their non-interest bearing deposits were (by definition) still non interest bearing.  While some of those deposits shifted from non-interest bearing to interest bearing, they didn’t shift that much.  As a result, the rise in the interest earned on their loans and their cash held at other banks more than offset the increase in deposit rates.

Their core NIM, so not including any impact from fees and such averaged 4.66% in Q2 2023.  This was only down 5 bps from Q1 after excluding a one-time purchase accounting adjustment.  On the call they gave some guidance of what to expect with core NIM.

I’m not sure we’ve ever dipped below about 4.25% or 4.3%. And so there’s nothing that we see today that would lead us to believe that we’re going to operate outside of those ranges. And I’m not saying that we’re going to go from 4.55% real time today to 4.30%, but if it happens, it happens. 

Their worst case scenario NIM is a drop to 4.25%-4.3%.  Their core NIM right now is 4.55% which means worst case it drops down somewhat but still pretty strong.  Moreover, 4.55% is their “real time” number and the number they say to use going forward.  Which suggests (and this is an important point) they have an expectation that we’re at the bottom.

But even with some continuing slippage in their margins, I don’t see much of an impact on earnings at all in Q3.  I modeled out Q3 assuming their overall NIM drops from 5.10% to 4.9%.  That assumes they see another, albeit smaller, drop in non-interest bearing deposits in Q3, that the re-rate on their loan book is less than Q2 and that their loan to deposit ratio stays flat.  I get earnings of $1.02 EPS, which is a drop for Q2 but not much of one.

Bank7 could manage this to be even better. By simply adding a smidge of growth to their loan book – say 2% sequentially, something that would only move their loan to deposit ratio up from 84% at end of Q2 to 85% – they could offset that drop entirely.   And given that their transactional and time deposit costs were already at 3.36% and 4.06% on average in Q2, there isn’t a lot of room for these to go much higher.  In fact some of those time deposits might be looking favorable as the Fed has raised rates again and loans are probably in the mid-8s or higher right now.

Is Bank7 a compounder?  It seems like I am likely to only really know this after the fact. As someone who is more of a generalist, who cannot know all the intricacies of the Oklahoma market or Bank7’s reputation there, I can only make an educated guess. Banking is a little trickier in this regard than other businesses. While it is relatively straightforward to evaluate a business’s product or service and its enduring value to customers, the value of a banks product, its loans, can only be known for certain in retrospect, after the loans are shown to be good and repaid.  All I can say is so far, Bank7 has the earmarks.  And they certainly think so: