Skip to content

Stocksatbottom

One of the most fortunate things that happened to me as I was just beginning to invest in stocks was stumbling on an investment newsletter called Stocksatbottom.com.

This was in the early 2000s.  That time wasn’t like today, what with Substack subscriptions from every Tom, Dick and Harry with an X account and a keyboard.  At that time most investment subscriptions were sent to you by postal mail.  An email subscription with a website was a relatively new phenomenon.

Stocksatbottom was run by a guy named Richard Stoyeck.  Stoyeck talked about his “team”, but honestly I think it was just him. If you looked Stoyeck up you’d find he had been a fairly high-level guy for one of the big investment firms, I think it was Bear Stearns.  But in the late-90s he got accused of insider trading and lost his job.  My guess is that he was in his 50s at the time.

Anyway around 2000 Stoyeck was probably wondering what to do with himself and so he decided to start-up this little internet investment newsletter called stocksatbottom.com.

Honestly, it was one of the best educations I could have had.

Stoyeck wasn’t a great writer but he was a great writer, if you know what I mean.  The stocksatbottom email alerts and round table discussions were full of grammatical errors, sentences cut off in mid stream and Stoyeck’s proficiency with this new fangled email-thingy was clearly lacking because there were often multiple fonts, multiple paragraph spacings and at time whole sections repeated within a single missive.

I also don’t think Stoyeck really cared much about selling subscriptions.  The newsletter never advertised from what I can remember.  At times he would go months, MONTHS, without sending out a thing.

But when Stoyeck did send something out it was a pleasure to read.  Stoyeck was amazing storyteller.  I have no idea if the stories he told were true but if they were he was connected to power brokers in Washington and Wall Street and he knew all kinds of inside baseball kind of info that was just so interesting to read.   He’d weave these stories into a thesis about a stock. He’d start off talking about the guy he knew in the Lyndon Johnson administration that headed up the Tet offensive and was friends with Frank Sinatra and by the end of the piece he was telling why this is why you should buy Disney (btw I wonder this might be the time to buy Disney?).

It was such great stuff.  When a new stocksatbottom email would show up I would actually get excited – and not “oh, a new idea to make money” excited but “I can’t wait to read this story” excited.

It really is a skill.

Anyway, there were a lot of lessons that I learned from Stocksatbottom and Stoyeck.  But the one that sticks with me the most is what Stoyeck based his whole newsletter around.

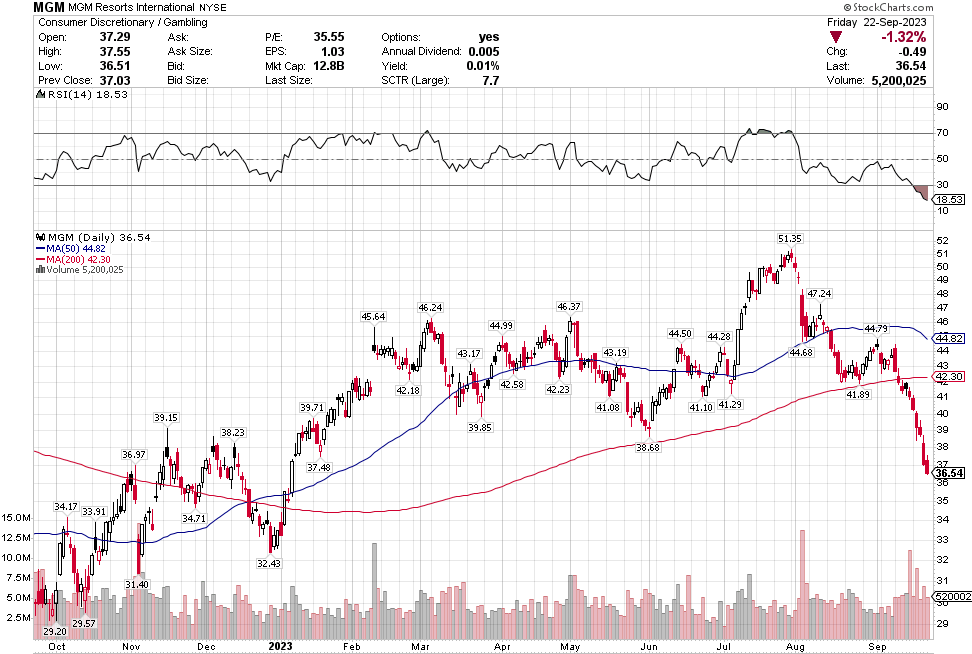
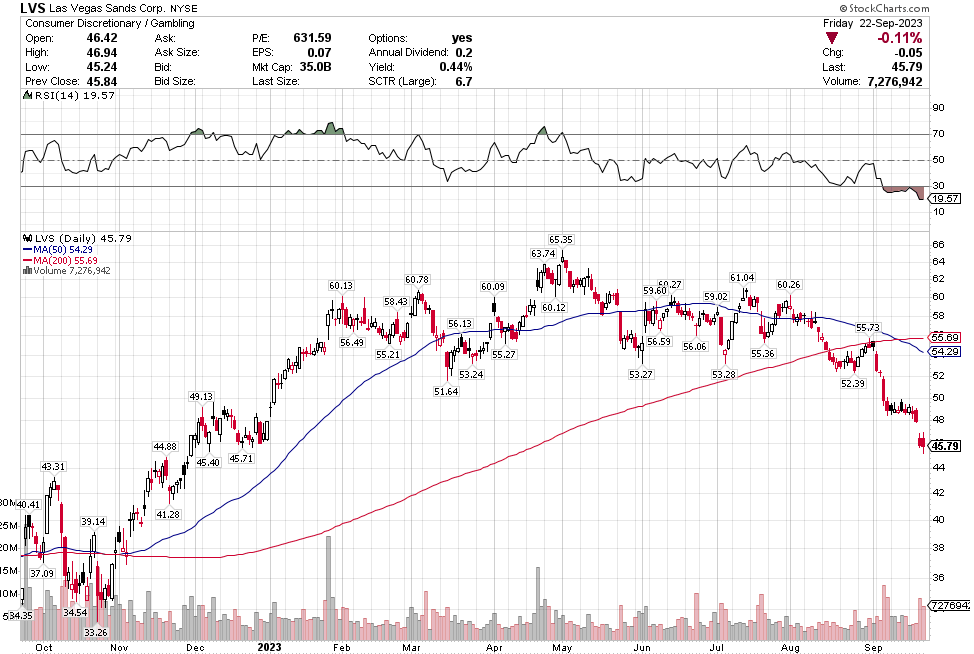
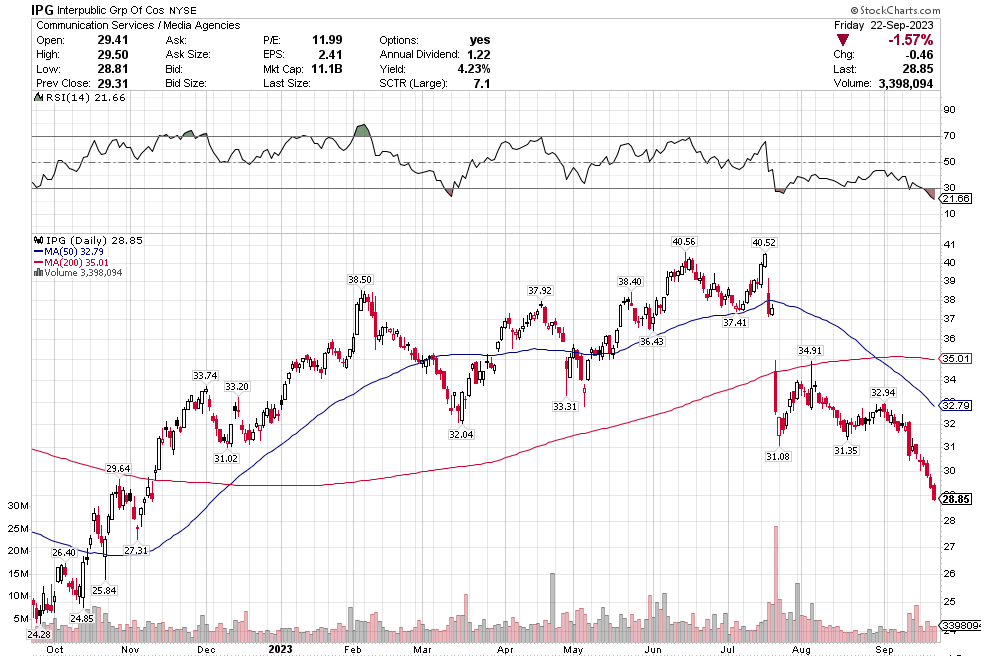
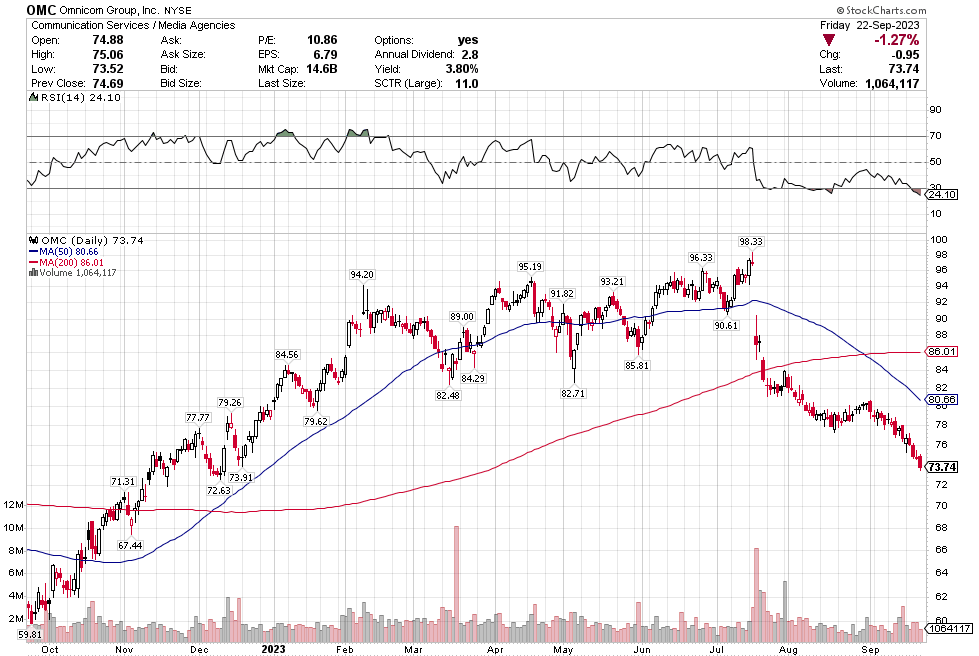
Stoyeck was like, look, you don’t have to go to small caps, you don’t have to go to micro caps to make money in stocks.  Take a look at the 200 biggest stocks in the S&P.  Go through their 52 week or 104 week charts. What do you see?   You see ups and downs.  Sometimes big ups and big downs.

Now pick one of the downs and then pick the next up. How much is the difference?  It can be 30%, 50%, sometimes 80-100%.

Stoyeck was talking about stocks like GE, Bank of America, Disney, McDonalds – the big names at the time.  He would say these are great companies.  They aren’t going away.  Sometimes they have a stumble.  Disney releases John Carter.  McDonalds decides to make pizza.  The market goes ape-shit and says the sky is falling.  You buy the stock.

It was such a simple, simple idea. Don’t over think it. Sure, check the numbers. Make sure the valuation makes sense. Sure the market has found fault in the name and there is probably good reason to have some fear.  That is why the stock is down.  If there wasn’t a good reason, the stock wouldn’t be down. The markets not stupid.

But as Stoyeck repeated over and over: once everyone is talking about it, it’s already in the stock.  Forget about it.  Ask yourself, what’s not in the stock?

Once the market forgets about what it has priced in and moves on, then it will look to the next thing. The stock starts to recover. Pretty soon the market is talking about good news. That new McCafe is taking share. I bet you that those old princess movies are ripe for another round.

That’s when you sell. Nothing goes straight up.  There’s always another stock being hated and you buy that one instead.

That was the essence behind Stocksatbottom.com.  Every year that I subscribed Stoyeck would wash, rinse and repeat with GE,  Pfizer, Bank of America, Proctor & Gamble, Office Depot, Macys, Goldman Sachs, Walmart and so on.

I was thinking about stocksatbottom this week because of what we went through in the last 3 months.

At the end of September I wrote this post about how much carnage there was across the market even though the indexes weren’t down that much.  As is often the case, the indexes followed suit.   Stocks were down big in October. It was a trying month.  We were getting ready to move at the end of October, and it was probably the best timing I could have asked for because it kept me from doing anything stupid. I just sat tight with those earlier buys even as I was down a lot.

A lot of the stocks that I mentioned in that post back in September kept going down all through October.  Stoyeck’s picks rarely went straight up. They usually went down first, which would make you write them off and forget them. Then he’d put out a missive 12 months later telling you he was selling that name for an 80% gain.

Some stocks I mentioned at the end of September did bottom at the beginning of October even as the market continued down. Stoyeck always said was that stocks don’t all bottom at the same time, which is why you couldn’t wait.

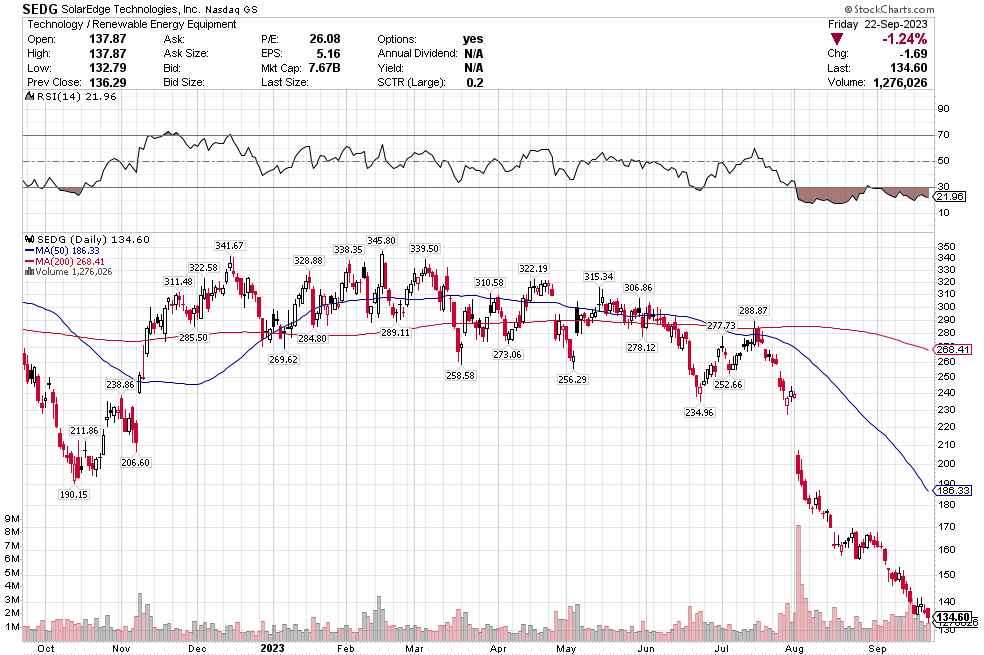
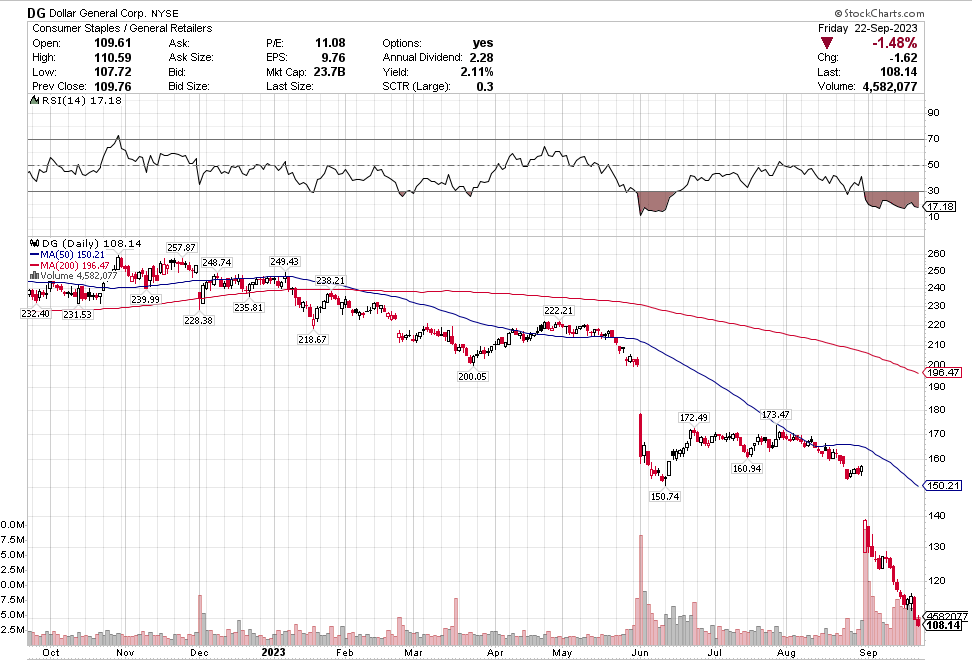
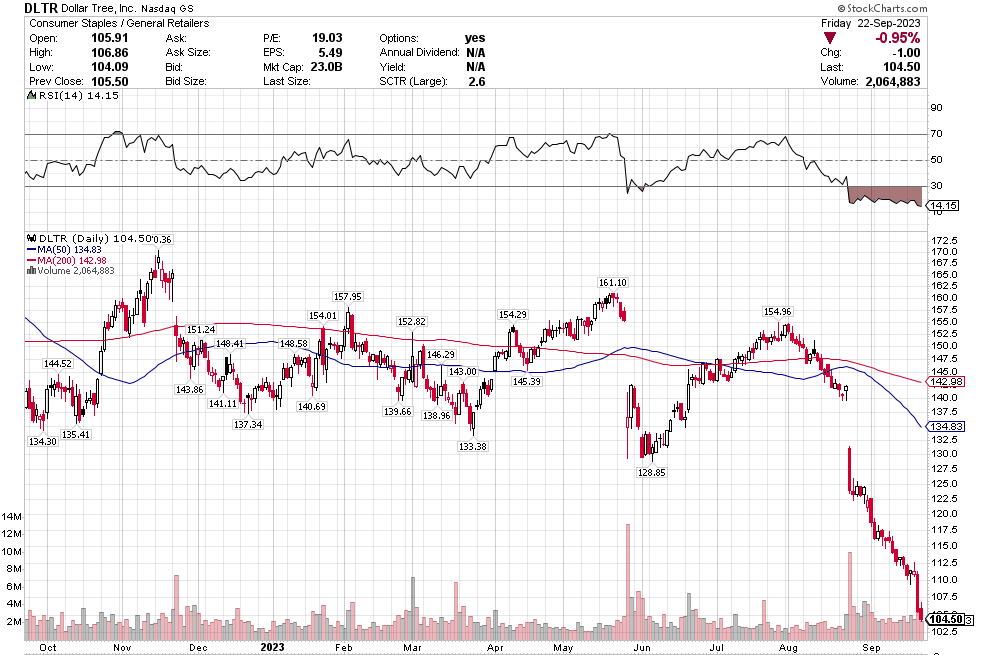
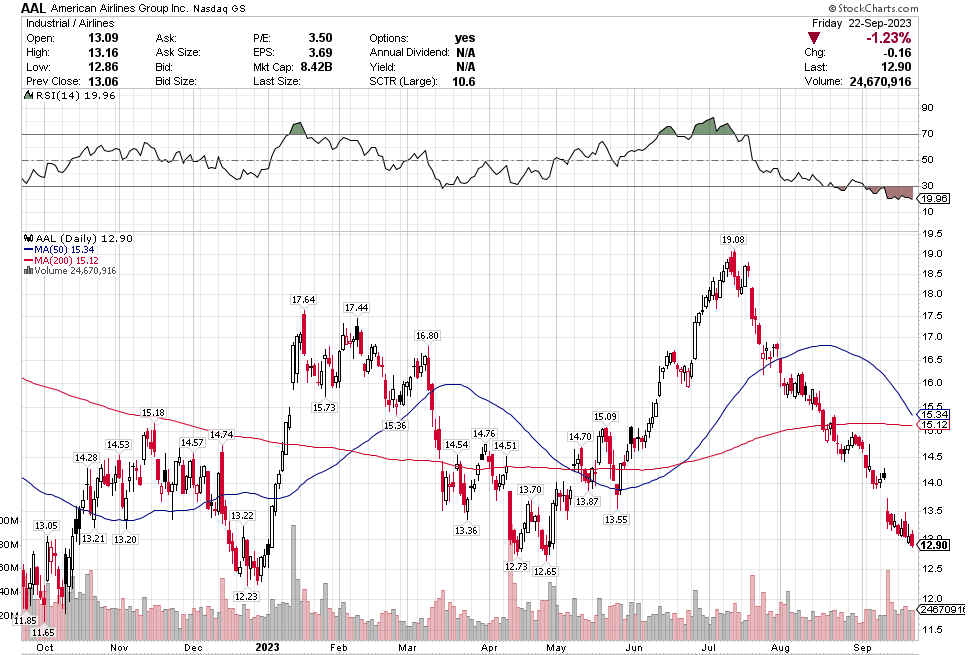
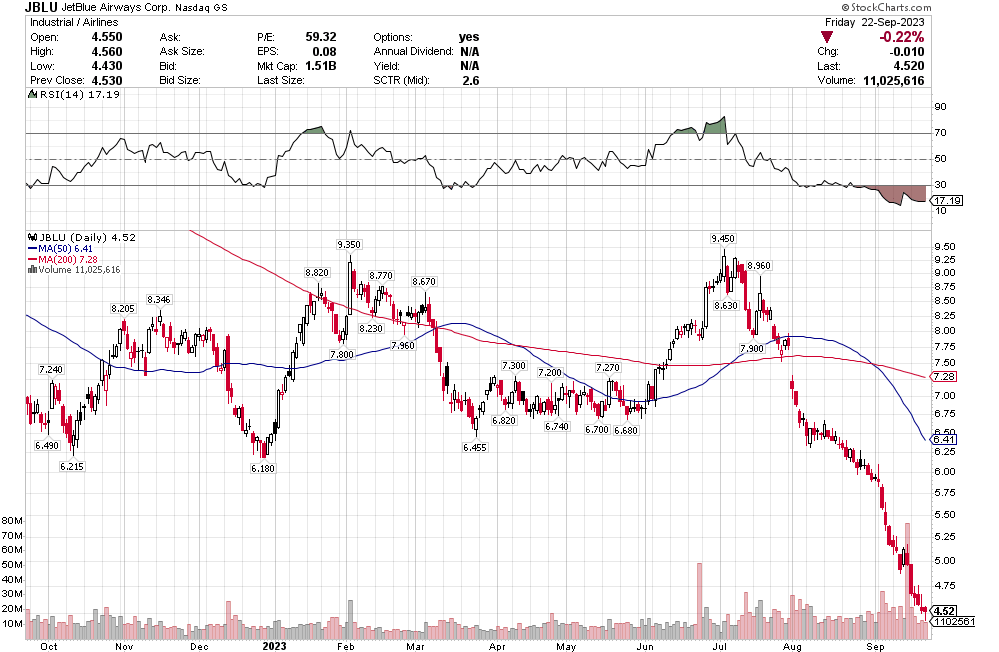
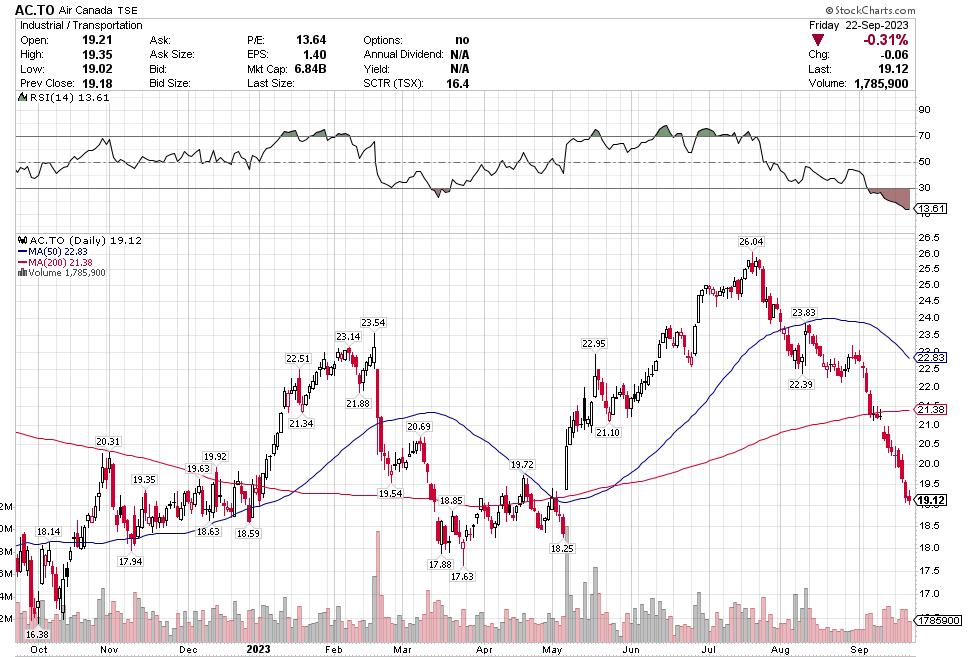
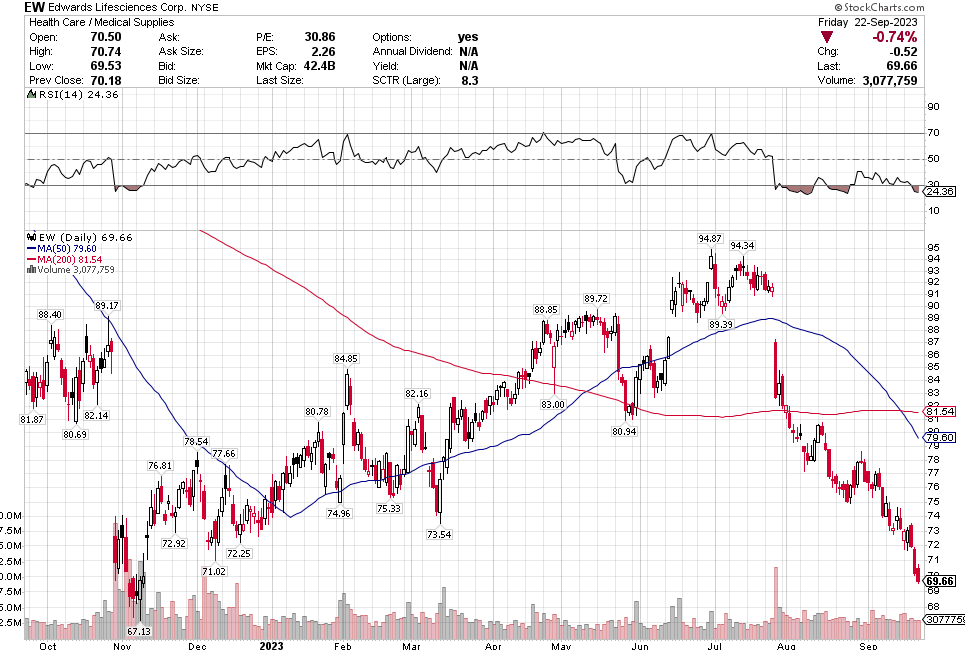
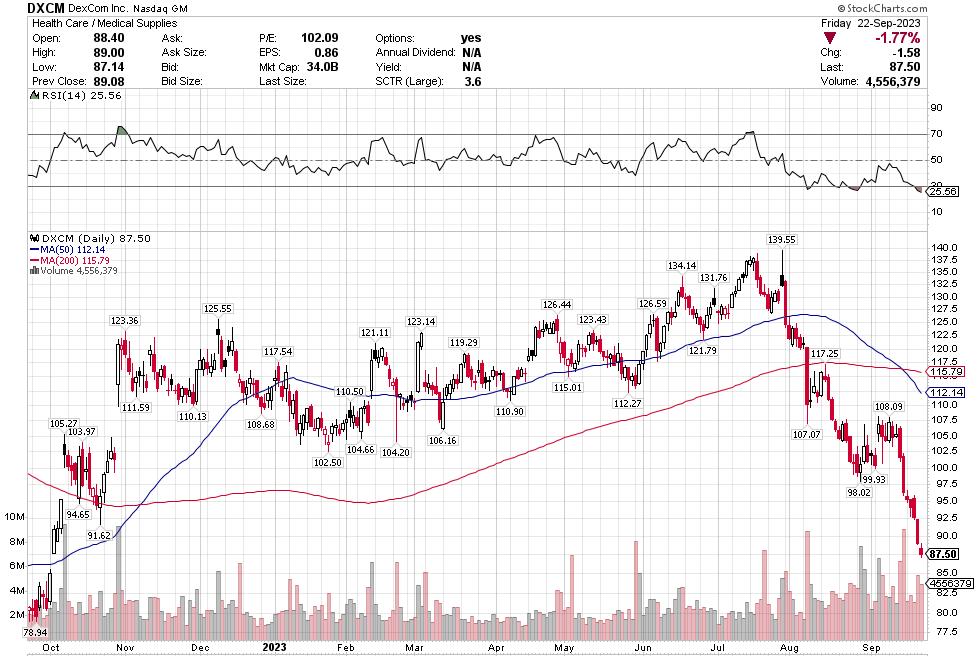
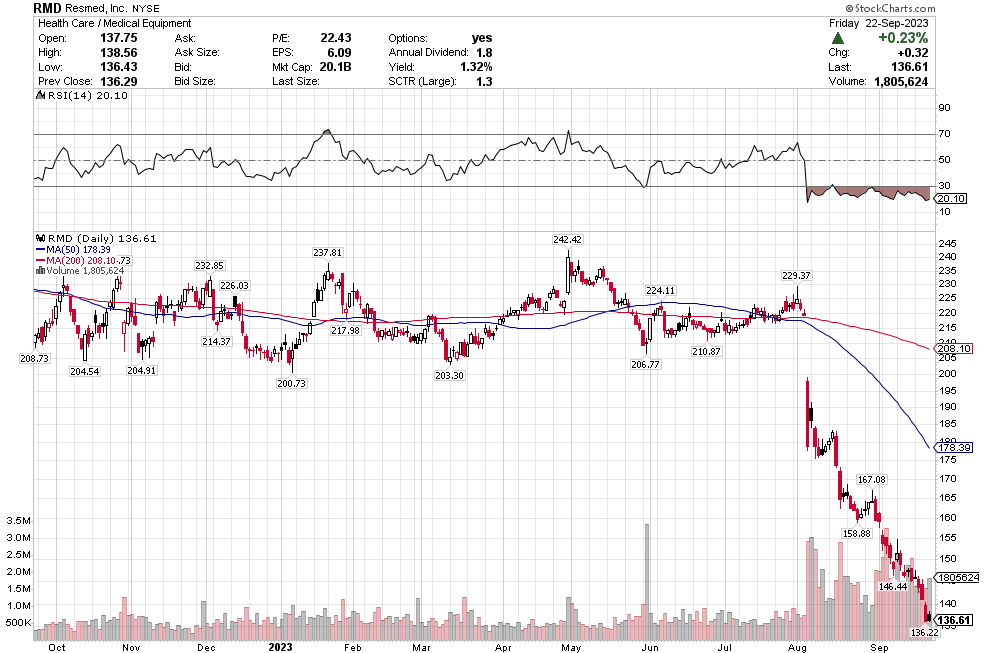
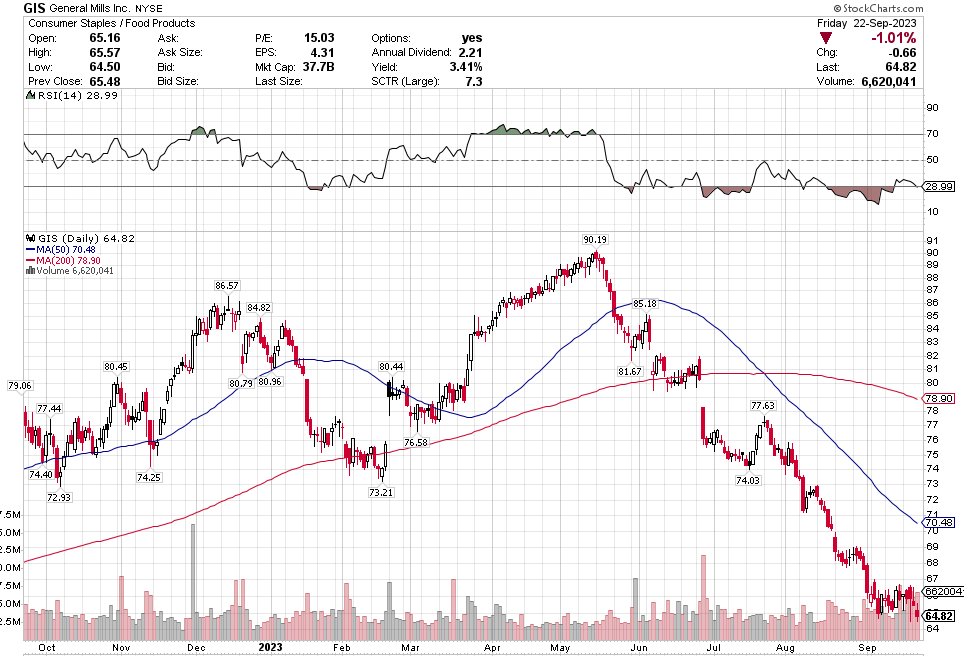
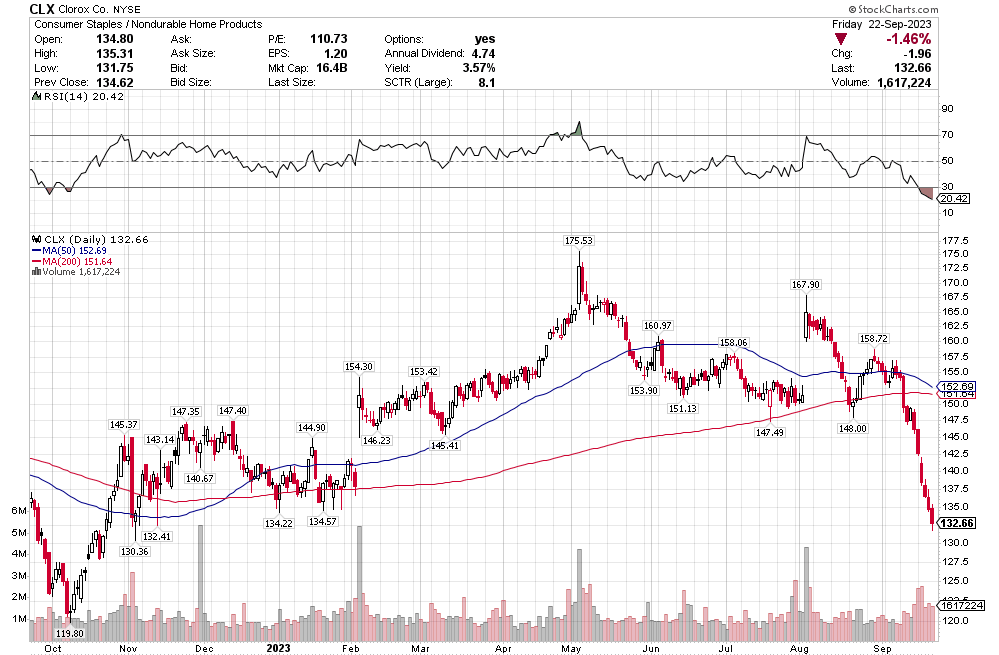
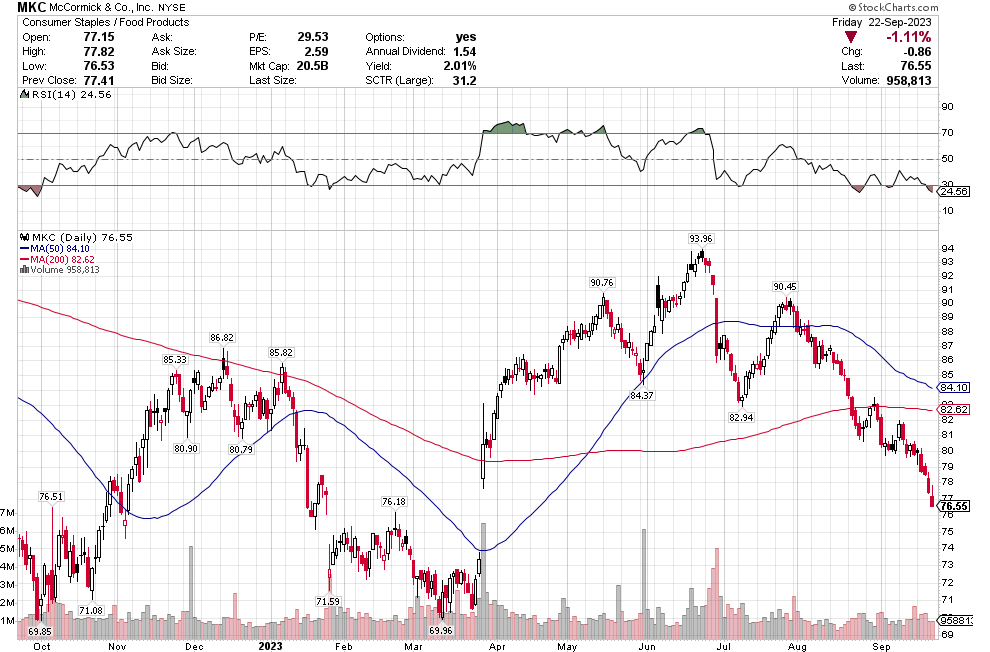
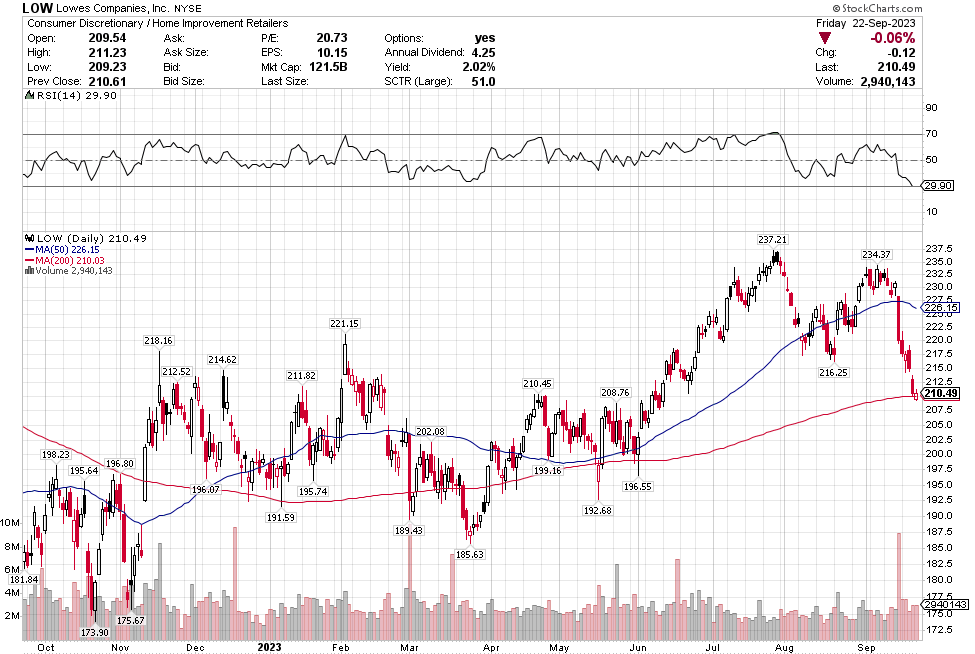
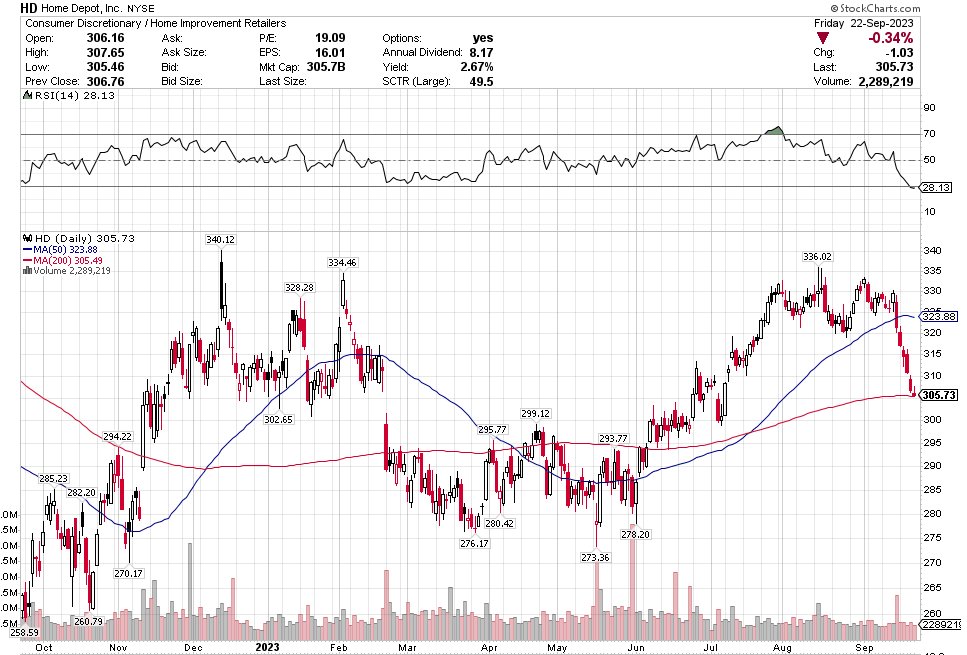
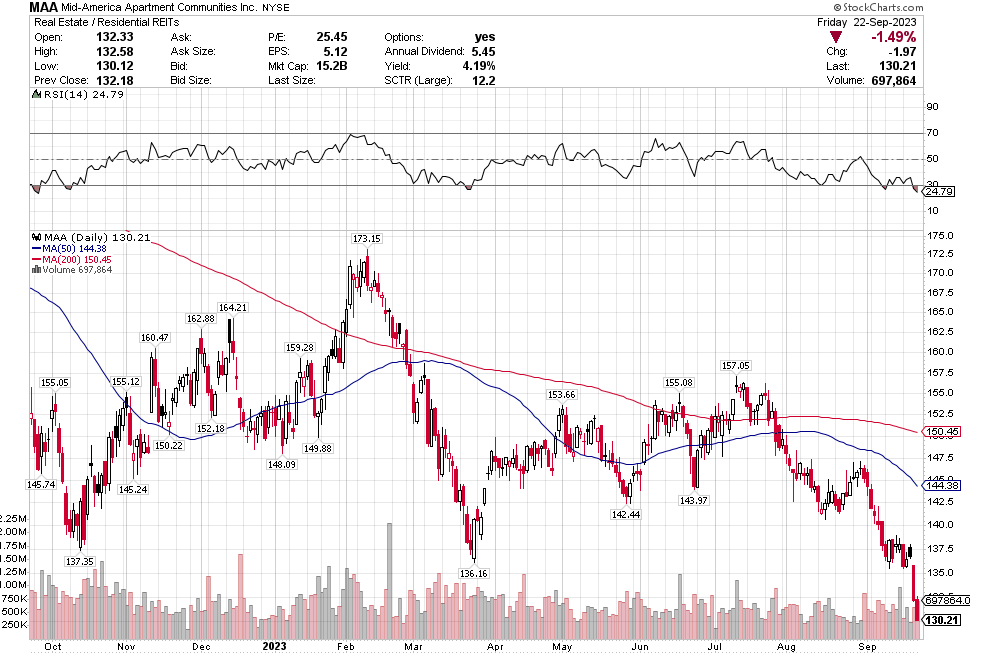
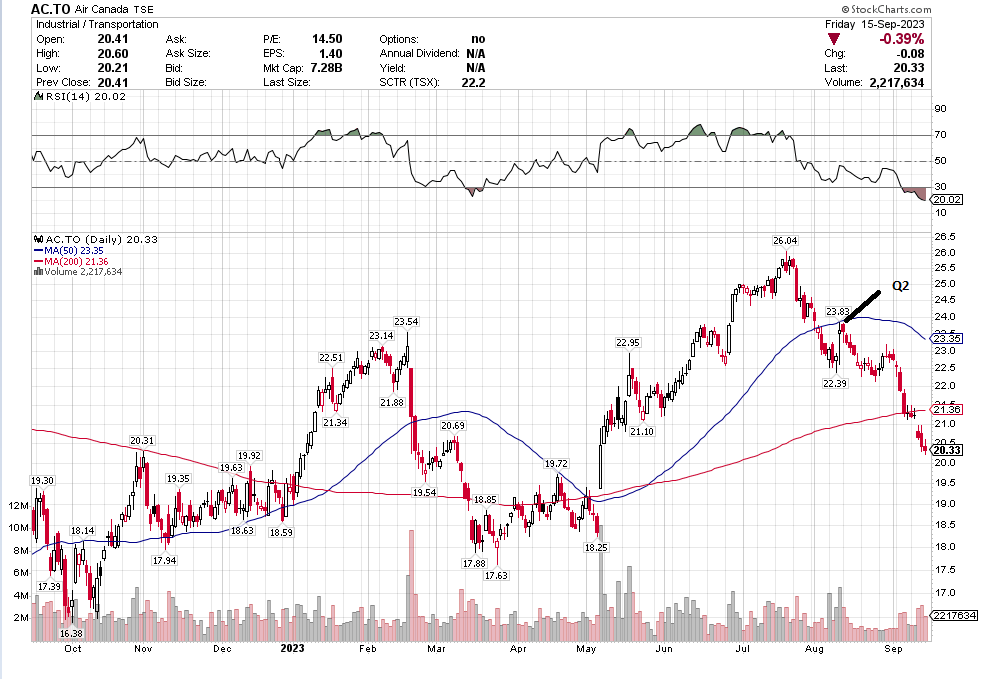
Many of the names I listed are now up.  Some of them, like HD, TGT, DLTR, the medical device names, the airlines, are up a lot.  There have been lots of 30%, 40% moves in medium/large caps even if you didn’t catch the bottom.

Some are not up much at all.  As they say, there’s always money in the banana stand.

As Stoyeck showed and as this market swoon and rally has proven once again, there are many ways to skin a cat.  You don’t have to dig into tiny microcaps, or pick SaaS growth or even find great businesses that you buy and hold forever.  Stoyeck had a heck of a run by simply buying low and selling high on stocks like Bank of America and Home Depot over and over again, and telling a good story every time.  Nice work if you can get it.

Hoping for a Turnaround at Mercury Systems

In the last few weeks I went through a whole bunch of sectors that are being blown out of the water.  Many of these sectors are getting creamed because no one eats any more. But there are a few that are falling for other reasons. One of these is the defense sector, where I found no relationship between its demise and the introduction of weight loss drugs.

Because I don’t think that Ozempic will eliminate armed combat I went through the defense sector stocks and bought three of them.  I bought some Lockheed Martin, RTX and Mercury Systems.  Lockheed Martin and RTX are big and diversified so I don’t want to bother writing about them.  Mercury Systems is more interesting.

Mercury is a sub-component supplier to the big defense contractors.  They make chips (things like power amplifiers and limiters, switches, oscillators, filters, equalizers, digital and analog converters, chips, MMICs and memory and storage devices), boards and sub-assemblies (things like switched fabrics and boards for high-speed input/output, digital receivers, graphics and video, along with multi-chip modules, integrated radio frequency and microwave multi-function assemblies and radio frequency tuners and transceivers) and full systems (display and communication systems for aircraft, sensor and scanning systems for aircraft).  These products are used as part of programs won by the direct defense contractors like Lockheed Martin, who use them and put into their end-products like aircraft, UAVs, radar systems and such.  They sell to 25 different defense contractors.

Mercury was a high flying stock for years and then in 2022 it fell out of bed.

Mercury was a growth stock up until this year.  The company grew revenue at an average rate of 22% per year from 2014 until 2023.  Then it stopped.

HOW DID IT HAPPEN?

What happened?  While there are lots of sordid details the essence of it is the same thing that happens to a lot of these growth stocks.  The growth disappears, margins fall and then there is no basis for the rosy outlook that has buoyed the valuation.

This was followed by a couple activist investors, Starboard and Jana Partners (they still own 5% and 7% of the company), getting involved and trying to sell the company.  That failed and the stock fell further.

The CEO and CFO were replaced, expectations have been reset with downward revisions to revenue and margins for this year and next, and the stock languishes in the $30s.

COST OVERRUNS ON DEVELOPMENT

That is the big picture.  The more detailed picture of what is leading to reduced revenue and margins is this:

Mercury has 20 programs that are under-performing. These are all (or almost all) development programs – so programs where they care coming up with a new product that will eventually be manufactured, and because they are contracted to develop these projects from the larger defense contractors, they get paid for it.

These 20 programs are going over cost and are draining margins.  Mercury noted on their last call that their portfolio is 90% firm fixed cost, so when a program goes over budget it falls 100% into margin.  These 20 programs accounted for $56mm of margin decline in F2023 and $29mm in Q423 – which is to say the vast majority of the under-performance.

Having cost overruns on development programs also leads to lower revenue.   “As total program cost increases on firm fixed price contracts the measure of progress on those programs decreases, resulting in a delay or reversal of revenue in the period the costs are recorded”.

That is the specific issue with 20 programs.  More generally, all the development programs that Mercury is currently working through is impacting margins.  Mercury’s usual mix between development and production is 20/80 but right now it is 40/60.  Development programs, even when they are performing at expectation, have a much lower margin profile – in the low 30s versus in the low 40s for production.

A MARGIN MESS

As a result of all this Mercury’s gross margins are a disaster.  They were down to 26.6% in FQ423 versus 41.3% in the previous year.  About 11.5% of this is from the 20 challenged programs alone.  The rest has to do with the mix of greater development programs and some unfavorable manufacturing variances.

That led to $21.9mm of aEBITDA in FQ423 vs $71.6mm in FQ422.

Some of this margin mess going to continue into their FQ124.  They said expect negative EBITDA and lower YoY revenue.  They don’t expect a real improvement in the business until the second half of their F24, which is after January.

Because the development programs have dragged on, it has impacted Mercury’s cash generation.  Mercury was a consistent FCF generator or years but in F22 and F23 they were FCF negative.  This is because their inventory and receivables grew, which in part was because of development programs that were buying inventory to go into production but then not going into production.  COVID related supply chain issues didn’t help.  This is expected to reverse here in 2024.

Mercury has said that working capital should be about 35% of sales.  That would be about $350mm whereas right now its about $700mm.

WHAT’S BAD IS GOOD

The good news is that development programs eventually become production programs and having all these development programs bodes well for future growth.

Mercury’s model is to develop products that will be used across multiple DoD programs.  So once they get through the development stage, multiple programs should benefit.

These are long-term headwinds.  Mercury said on their FQ3 call (this was the former CEO) that the programs would complete in the next 2-3 quarters and reiterated something similar on the Q4 call (their new CEO said this).  This excess of development programs that are coming in above budget should sort itself out by next summer.

Their bookings and backlog don’t seem too bad to me.  Their backlog gives them 70% revenue visibility for 2024, which exceeds their historic coverage ratio.

Of course, they also had 80% coverage ratio going into Q4 and they still missed guidance.

REBUILDING TRUST

The story here is about getting margins back to normal and then seeing these development programs turn into production programs and generate revenue growth.   Mercury expects that in 2024 they can get their EBITDA margin up to 16.8%-18.5%.   The longer term goal is getting it to 20%+.

But these margins will be below YoY level in the first half of F24.  So it will take time.  And the market will be skeptical because they have disappointed in the past.

As recently as the Nov 2022 call (FQ123) Mercury said they thought they could get to 20% EBITDA margins in F23.  And they said on the FQ2 call that EBITDA margins would be 30% in Q4.  That was reduced to 18% guidance in FQ3 and then it came in at 8%.  One analyst on the FQ4 call demonstrated the disbelief: “I still don’t understand how it got cut 45% in 90 days” which is about as close as analysts come to saying WTF are you doing? 

There is a lot of trust that is going to have to be rebuilt after this level of miss this fast.

I think there is also a lot of skepticism simply because the previous CEO was misrepresenting what was happening in the business as Mercury tried to sell itself.  He kept calling out “supply chain” as the issue.

We expect margins to naturally return to pre-pandemic levels as we overcome current execution challenges and as the supply chain conditions continue to normalize. Further margin expansion will follow is the late-stage development programs transition to production, and as we return to a more normal 80/20 business mix over time.

In retrospect, it seems like the former CEO was lumping in supply chain with the real issues, saying stuff like “we’re driving continuous improvements in new product development, supply chain, operations and program execution”, which made analysts think the problems were transient supply issues out of the companies control and not program issues that were.

The new CEO is straightening that out and now its clear there was more going on.  Here is the broader explanation from the Q3 call:

In fiscal ’19 through fiscal ’21, we achieved a significant level of design wins, both organically and through acquisition, especially as related to the physical Optics Corporation acquisition. These design wins were predominantly within secure processing and mission avionics, 2 of our key strategic growth areas and translated into development contracts in our backlog. The onset of COVID in fiscal ’20 and the transition to remote work added latency to our development efforts.

Slightly thereafter, supply chain delays began to limit availability of critical components followed by the great resignation, which created labor constraints across a number of our program executing functions. We began to see some margin reduction in fiscal ’21 and fiscal ’22, partially offset by lower R&D expenses as more engineers charge labor directly to these development programs.

This resulted in increased levels of CRAD as discussed in many of our prior earnings calls and public filings. The higher engineering labor content, coupled with low unit volume on most development programs contributes to average gross margins in the low- to mid-30s on these programs.

I don’t think supply chain was what analysts were being told it was.  It was really that they had ordered inventory that wasn’t getting used because their development projects were off-track.  That is my suspicion anyway.  One analyst called it out with the new CEO on the Q4 call, asking why all of a sudden there were no mentions of supply chain after hearing that the problems were nothing but supply chain before that.

There is also skepticism because the number of problem development programs increased pretty substantially from Q3 to Q4.  In Q3 it was 12.  In Q4 it was 20.  So there is probably a bit of wondering what it is in Q124.

As a consequence of all these half-truths and the skepticism it has created, I feel like the new management team is really being conservative on guidance. When pushed they admitted they are erring on the side of caution here and the numbers bore that out.

WHAT IS IT WORTH?

During the years that Mercury was a growth company, they maintained pretty consistent EBITDA margins.  The dip in margins in 2021 and 2022 could have just been COVID supply chain, more maybe it was the beginning of the bigger issues we see now.  It’s hard to really say.  But margins didn’t really collapse until this year.

At today’s price of $36 I estimate that the stock pricing in basically no growth (say 3% average for the next 10 years) and at least a four year grind to get back to historic EBITDA and FCF margins.  Which is to say that there is very little of a potential turnaround priced in.

If Mercury turns it around, recovers to historic margins and shows that they are a 10%+ grower again, this is quickly an $70-80 stock.

There are a bunch of ways of getting to that valuation.  A DCF model can give you $30-$35 fair value at 3% growth and $80+ at 13%.  If you look at it from a multiple perspective, Mercury traded at an average of 21.5x EV/EBITDA over the period from F2014-F2022.  If I use that multiple, assume that they recover to 19% EBITDA margins in F2025 and, after not growing at all in F2024 they get back to 13% growth in F2025, I get a 2025 stock price of $71.

Everything points to a current stock price that (not without reason) is discounting a lot of skepticism about the turnaround, about the numbers and about Mercury’s ability to pull out of this slump.  And the upside is roughly a double.   Which I think makes it a good risk/reward.

Falling Knives in the S&P

The S&P index is down about 6% and the Nasdaq about 8%.  By these measures, thus far it has been a correction but not a steep one.

But it doesn’t feel like these moves in the indexes tell the whole story.

You get a bit better sense of how the market has been performing by seeing the larger swath of small-cap companies included in the Russell 2000 index, which is down 11% from its high in late July.

There are some individual situations that are much worse.

This weekend I went through the individual stock charts of all the S&P names looking at what has really been crushed.  The knives that have fallen the most.  On Twitter I made the following comment:

The funny thing about the above portfolio is how diversified it is. You have growth, defensives, cyclicals, healthcare. There is not a lot in common between the sectors that have performed the worst.

Maybe what is in common is who owns them? @CorneliaLake, a very smart guy who would have much more knowledge into this than I have, responded to my tweet with:

So maybe that explains it to some degree?

My history with catching a falling knife is good and bad.  I’ve had some good luck with it recently – in December I bought a lot of SaaS stocks that were going down every day.  Before that I bought Meta when it fell to the 80s and Amazon when it fell to the 90s.

Other the other hand, there have been plenty of cases where it hasn’t worked.

Here are some knives that have fallen a lot. 

Solar

Some of these solar stocks have just gotten killed.  I have read that the residential solar market in the US and Europe is slow and that because demand was so strong last year, the market over-ordered and that has caused an inventory glut.  That is why Enphase and SolarEdge are down.  Tesla is also making more of a push into solar, which adds another formidable competitor.

I’m less certain why First Solar is down, since they sell into the utility solar market and that has been okay from what I have read. 

On the positive side, the longer-term demand picture for solar remains intact and underlying demand, especially in Europe, continues.  Solar also benefits from higher energy prices, which are beginning to happen again.

Dollar Stores

The dollar stores have been crushed.  I have looked at Dollar Tree but not Dollar General.  It appears that what started it all for Dollar Tree was when they raised revenue guidance for Q3 but did not raise earnings guidance.  Of course that meant that margins were under pressure, which crushed the stock.  I assume the same is true for Dollar General.

Today, these stocks are cheaper than they have been in at least 10 years.  Dollar Tree buys back a lot of stock, they reduced their share count by almost 100mm shares (over 30%) the last 10 years.  Dollar Tree has traded in a range of 1.1x EV/sales to 1.5x EV/sales over the last 10 years.  Today its at under 0.8x.    One odd thing about these dollar stores is that the Canadian comp, called Dollarama, is just off its 52 week highs!

Airlines

I already wrote about Air Canada last week.  It has continued to go down.  It is not the only one.   The entire airline complex has been in free fall.  Yet I read a piece from Wedbush this week that said air travel (and more generally travel) demand is slowing from the summer heights, but still holding up just fine. 

The airline stocks are trading like a massive recession is upon us.  Even stalled out oil prices hasn’t seemed to helped.

Medical Devices

One of the surprises when I went through the list of S&P companies was the number of medical device stocks that were just in free-fall.  Edwards Life Sciences, Dexcom, Resmed and Teleflex are all disasters.

These companies are all growing the top line.  They are profitable.  Yet they are down near or even past their COVID lows.

It took me a while to figure it out.  It all has to do with Ozempic and the weight loss drugs.   Some of these are obvious – for example Dexcom is glucose monitoring for diabetes.  Some are less obvious – for example it turns out Resmed makes money from sleep apnea therapy and sleep apnea is more prevalent in obese people.  Who knew?  Of all the names Teleflex looks most interesting because they are pretty cheap on earnings and I’m also not really sure how Teleflex is related to Ozempic, which makes me wonder if it is being caught in the downdraft.

Staples

Some (but not all) staples, like General Mills, Clorox, Hershey, McCormick & Company and Kimberley Clark have been hit pretty hard.  Some of this is again due to the weight loss drugs – like Hershey for example and probably General Mills. 

Some of this is likely just because these companies are really expensive and with interest rates rising some of their multiples are coming down.  These are names I have been paying attention to because I was actually right about a few of these – I was short both Kimberley Clark and Clorox.

I think General Mills is worth a closer look.  I haven’t spent a ton of time on it yet but reading through their quarterly results, which they released just this week, and it seemed ok.  They reiterated guidance, are going to grow 3-4%, grow earnings and FCF 4-6%.  The stock trades at 14x PE with a 7.5% FCF yield which actually seems reasonable to me.  It is a whole lot cheaper than some of the staples I was looking at last year, when they seemed to all trade at 30x earnings.

Hardware Stores

These are more recent victims.  Lowes and Home Depot have done very poorly over the last couple weeks though both are still up on the year.  It is probably too soon to be thinking about these stocks but at some point they would be interesting.  It looks like HD trades at about 20x PE and LOW at 15x, so these are crazy cheap but not crazy expensive either.

REITs

The REITs are pretty ugly looking in general, which I guess isn’t surprising with rates so high.  Nevertheless, I am a little surprised that names on the apartment REIT side, like Mid-America Apartment Communities, is doing as badly as it is.  Maybe I am biased from living in Canada where it seems like housing shortages are on the front page.  This is another weird one where the Canada comp seems to be opposite.    When I look at Boardwalk, an apartment rental company here in Canada, the chart is at its highs.

Casinos

Las Vegas Sands and MGM are in freefall right now.

Advertising

I don’t know a lot about this sector but I plan to learn more.   Interpublic Group and Omnicom both provide advertising and marketing services.  Both of these companies are trading at 10% FCF yields and under 10x PE which makes them interesting.

Those are the sectors that I see performing the worst of late.  Maybe most encouraging is that other than these sectors, most stocks in the S&P seem to be holding up okay.  I did not see any wide spread collapses.   Some of the charts look a little rough because of the sell-off Thursday but we’ll have to see if there is any more follow through.

What to do with Air Canada

Air Canada has gotten whacked since it released its Q2 results.  The stock popped on the day of the results and has fallen since.

I took a small position in the stock at $22.50, when it dipped after a good earnings report.  I thought: it was a good quarter, they guided well for Q3, the economy continues to do okay, they are hedged for fuel, and the stock is pretty oversold.

That reasoning has not turned out very well.  The stock has continued down, all the way back to $20 and now we are really, really oversold.  My loss is at that 10% level where I usually revaluate and often admit defeat.

Q2 WAS GOOD

Air Canada had a very good second quarter.   Revenue was up 36% YoY and they had $1.2b of aEBITDA, which is an aEBITDA margin of 22.5%.  FCF for the quarter was $965mm which is up $537mm from 2022.  They raised the low end of  their FY EBITDA guidance.

Air Canada said that their international segment was really strong, up 70% YoY.  US transborder was up 26%.  Domestic Canada revenue was up 15%.  The only real down business was cargo.

They said that “based on current passenger booking patterns, we see prevailing strength in travel demand over the second half of 2023, giving us confidence to increase the lower end of our adjusted EBITDA guidance range”.

PILOT SHORTAGES

They slightly reduced their average seat miles capacity and decreased their average cost per available seat mile guidance for the full year.

It sounds like the reduction in ASM is due to pilot shortages and planes that are taking longer to put back into service.  In fact, at the end of August they removed routes out of Calgary to Ottawa, Halifax, Los Angeles, Honolulu, Cancun, Frankfurt because of the shortage.

Pilots are also an issue for Air Canada because their contract agreement is up next year.  WestJet pilots and some of the american airline pilots got large raises this year.

FUEL COSTS

All the airlines are getting hit because of fuel costs.  Spirit and American both warned this week with Spirit raising their fuel cost estimate from $2.80/g to $3.06/g and AAL raising their from $2.60/g to $2.95/g.  US$3/g works out to about C$1.08/litre.

Air Canada was pretty smart about fuel prices.  They are one of the few to hedge out some fuel costs for Q3. 

That works out to about 79c per litre in Canadian dollars.  Which is well below current jet fuel costs.  Their guidance for the FY calls for C$1.08 per litre assuming a $1.34 US dollar. 

In Q2 Air Canada’s fuel cost was $1.01 per litre vs $1.47 per litre in Q2 2022.  Just looking at roughly the impact, Air Canada used 1,162b liters of jet fuel in Q2.  A 10c move in jet fuel would be about $110mm more costs per quarter.  EBITDA was $1,220mm in Q2.   So big moves in jet fuel can certainly impact results.

I think its fair to say that Air Canada’s Q3 results aren’t going to be impacted by fuel costs like the other airlines because of the hedge.  But post-Q3 their costs will be hit if prices stay this high.

PROFITABILITY

Air Canada margins have improved a lot since before the pandemic.  Gross margins in Q2 were 14.8% vs 8.8% in Q2 2019 and 7.1% in Q2 2018.

In what is kind of an amazing flip from when I liked the stock in the 2015-2018 period, Air Canada actually has better margins than its peers:

That has led to this higher profitability.  Air Canada’s available seat miles (ASM) was 24,606 in Q2 2023.  This was about 3,000 seat miles less than 2018/19.   But the company still generated significantly more EBITDA and cash flow than both those years.

Air Canada has a lower market cap today but more debt (which is a carryover from COVID).  Net debt is $5.3b vs 2019 net debt of $3.3b.  The overall enterprise is still about $4b lower than it was in 2019.

They are actively reducing debt – they announced $589mm of repayments just last week.

Here is the big question – should it be cheaper today than 2019?  Yes, there are headwinds on fuel and pilots.  But margins are better.  Growth into 2024 looks better.  Competition in Canada looks more favorable.

If Air Canada can maintain margins and continue to add capacity (they are calling for a normalization of their capacity to 2019 levels by 2024), I think you can make the argument that the discount is not warranted.

To get the same enterprise value as the end of 2019, Air Canada would need a $32 share price.  That is $12 more than the price today and a 60% return.

Of course the case to be made against Air Canada is that margins aren’t going to stay at this level and Air Canada is fairly valued versus where comps are today.  The table I made above showing them and other airline multiples is from RBC.  The stock trades at average multiples on 2024 estimates – 5.1x EV/EBITDA.

But RBC is pretty bearish on 2024.  They are estimating $3.27b EBITDA in 2024 vs. Air Canada’s guide of $3.5b to $4b.

Another strike against Air Canada is that is has been pretty crappy to fly on.  It does not have the best consumer metrics, in fact on some measurements it has some of the worst consumer metrics, which is a strike or two against it.

On the other hand, I really kind of wonder how much it matters.  Air Canada and WestJet basically have a duopoly in Canada.  I see that first hand, and I suspect that they have used COVID to come to a mutually beneficial (unspoken) arrangement in that duopoly, with WestJet dropping eastern routes and Air Canada dropping western routes.

That could be why their margins are now as strong as Delta and American, and better than United, Southwest and Jet Blue.  In Q2 margins were higher than they have ever been for that quarter.

They are in a weird spot.  Air Canada has record high demand, loads and fare giving them record margins and loads of cash flow.   The argument that RBC is making is  that this is as good as it gets – but to what stock price?  The stock needs to get well into the $30s  to get to 2019 levels and that is a time with lower margins.

They were at the Morgan Stanley conference last week, which would have been the opportunity to warn on fuel if they were going to do so.  They didn’t.

Also factor in that because of the extremely strong cash flow Air Canada should be able to reduce debt by another $2 billion by year-end 2024 – which if you add that to the stock price is another $5.50 per share.  Air Canada produced $965 million of FCF in Q2 and $1.95b of FCF in the first half of the year (though much of this was changes in working capital).

Honestly, I don’t know what to do about this one.  Hold or give up.   I can see reasons both sides.   Sometimes decisions aren’t cut and dry.