Skip to content

Posts from the ‘Uncategorized’ Category

Research: Inspired Entertainment

I bought a small bit of this one this week at a little under $3. I don’t love it, but I do think its reasonable and its probably a bit of a post-COVID play, given that they were getting creamed on the top line from casinos and bars being closed or empty. But I remain a little wishy-washy on it because I played their virtual games online (you can play them for free here) and they were kinda boring to me and they don’t really generate FCF so far.

Just to catch up on the week, I also bought some ELMD today, I’ll get my research on that out. I’ve been watching that one for a while, it has been quite the waterfall but its getting back to a level it seems interesting. I also bought some CWH earlier this week on its pullback, sold my Luby’s yesterday, sold 1/3rd of my Innodata on the pop earlier this week (why is it going up?) and sold Enlivex on the COVID results (its like 5 patients so its probably a little ahead of itself, though it does make sense as a treatment).

Anyway, here is some notes on Inspired Entertainment:

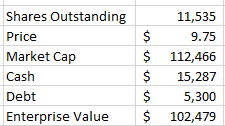
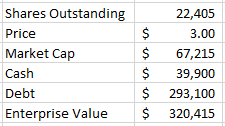
  • $67mm market cap at $3.00, whole lot of debt
  • global games technology company
  • supply virtual sports, mobile gaming and server-based gaming systems
  • customers are lottery, betting, gaming operators

Segments

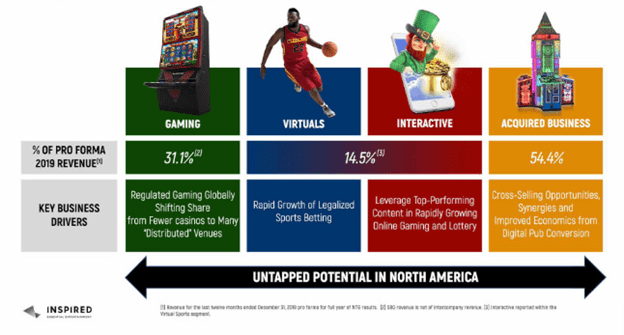
  • operate 4 segments:

Gaming

  • gaming is digital slots and gaming machines that are in casinos, bars, etc
  • server based so you get change in/out games without replacing machine
  • 2,900 additional terminals contracted for deployment
  • 32,800 terminal out there at end of Q220 – this is down 10% yoy
  • they collect revenue sometimes on sales of SBGs and sometimes through participation
  • their games are located on a network – distributed to casinos, allows them to access broader market
  • They get an avg participation rate in the games of 6% – so 6% of profits goes to them
  • They describe it like this – Customer Gross Win accrued in the period after deducting gaming taxes (defined as a regulatory levy paid by the Customer to government bodies) and applying the Company’s contractual revenue share percentage
  • This has been majority of revenue – more than half last year, and was ~70% of revenue in Q419 before COVID
  • Operate in UK, Greece, Italy Illinois
  • 75% comes from UK operations

Virtual Sports

  • available in 44,000 retail channels, 300 websites
  • they receive portion of revenue generated from the game plus upfront license
  • these are games like Golf, Basketball, Soccer, Horse Racing, etc:

  • It doesn’t look like its real players or teams, they use plays off of names
  • Its not exactly a video game, it looks close to real, and you basically watch a match, which is not a whole match – for golf its like a hole or 3 holes – and you bet on the winner, long drive, etc
  • I played the golf and basketball, it seems kinda boring to me tbh but what do I know
  • I think the “interactive” segment, which is just a subset of Virtual Sports, are just the games that aren’t sports related, so the bingo, lotto and the Centurion and Reel King – which are just slots from what I can tell

Novomatic

  • This is the acquired business
  • acquired Oct 2019
  • supplier of Category B1, B3, C and D gaming terminals
  • while the other segments are asset-light these guys are basically terminal manufacturers
  • this is a different business than the rest – these guys sell “analog machines” while the rest of what they do is digital gaming over a network
  • products are installed at pubs, arcades, motorway service areas and holiday resorts in the UK
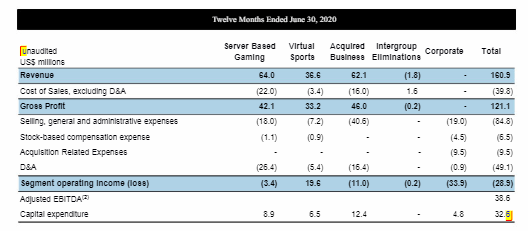
  • but it is a high margin business – if you take a look at the Pro-forma below its more than 75% gross margins
  • I’m not sure I understand the acquisition – it seems to be something about taking this Novomatic and making their analog machines, which is their bread and butter, digital, to make them more profitable
  • They go to pains in their presentation to differentiate and show how much digital is:

By Area

  • have 16,000 machines in UK – this seems low?
  • Scotland is about 10% of volume
  • – 8,300 machines in Greece, recently deployed 380 Valor terminals
  • Recently sold 161 Valor terminals in Illinois – said they have sold 275 in the US in total – I’m not sure if that is all Illinois or some other state(s) as well?
  • Are planning to deploy 100 terminals into Western Canada

Financials

  • this is the pro-forma EBITDA including the Novomatic business for 2019:
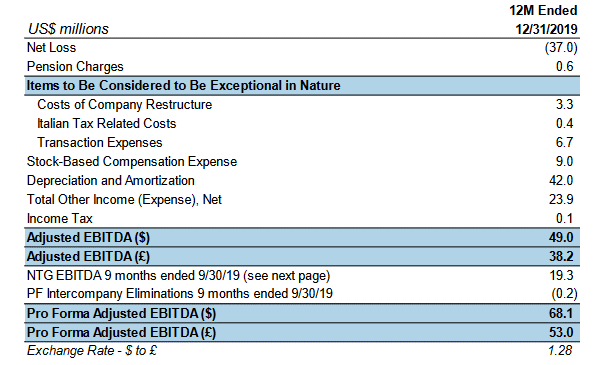
  • would have been $68mm
  • right now EV is $320mm – 4.7x EBITDA
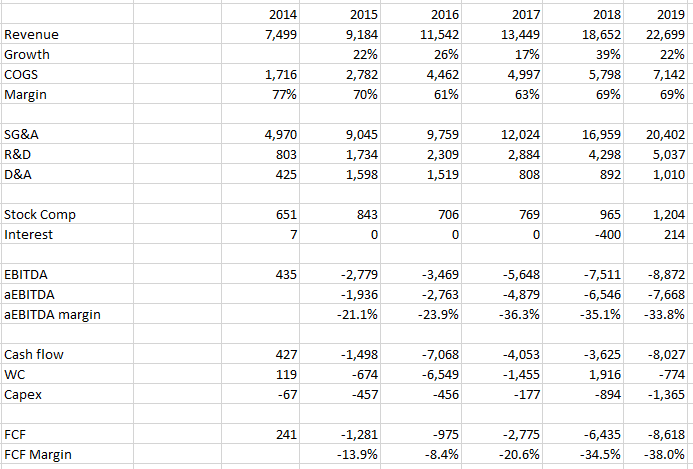
  • They generate decent EBITDA but it doesn’t really follow through into FCF:
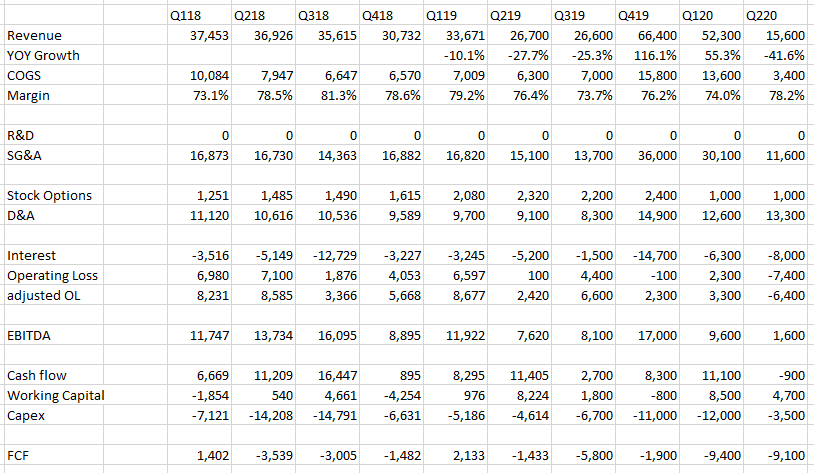
  • I probably need to dig into why the FCF is so bad (whats the CAPEX?)

Customers

  • operators of lotteries, licensed sports bookmakers, gaming and bingo halls, casinos and regulated online operators, adult gaming centers, pubs, holiday parks, and motorway service areas
  • key customers: William Hill, SNAI, Sisal, Lottomatica, Betfred, Paddy Power Betfair, Genting, Bet365, Sky Bet, Fortuna, the Greek Organisation of Football Prognostics S.A. (OPAP S.A.), GVC Holdings Plc (including Ladbrokes Coral), the Pennsylvania Lottery, Bourne Leisure, Greentube, Stonegate, Mitchells & Butler, Marstons PLC, Greene King, JD Wetherspoon PLC, Park Dene Resort, Centre Parcs Resorts and Novomatic. Geographically

Q2 Results

  • basically, their entire retail business shut down in March
  • their online business accelerated – Virtual Sports:

Our Q2 performance is noteworthy due to the outstanding performance from the online virtuals part of that business, which increased over Q1 by 76% and was 109% higher than the same quarter in 2019.

  • their retail business is small, local venues, expect them to come back online quickly
  • said they are beginning to see a quick ramp in Greece, Italy and UK
  • in Greece operating above pre-COVID levels
  • in UK are seeing less machines operating at William Hill due to distancing
  • Italy numbers close but slightly lower than pre-covid
  • they reduced their headcount from 1,800 to 300
  • managed to be EBITDA positive in Q220 – $2mm of EBITDA
  • their margin actually goes up when shops close if revenue of remaining shops increases proportionately

Research: Datadog

I should be spending my time researching a stock I might buy or at least short.  DDOG is neither.  But I still find it super interesting to look at so I spent a bunch of time on it.  I really didn’t look at everything.  I got caught up on pricing, which I will explain, and spent a lot of time on it.  I captured a few comments and such as highlights but I read way more in terms of opinion and perception of DDOGs product.  These are my thoughts.

Here is the thing about DDOG.  It is, by all accounts, a great product.  You read the forums, it is best in class by most accounts.

But.  A couple problems.  First, this is not some revolutionary technology.  What DDOG has is a monitoring tool.  It really boils down to a GUI – a dashboard.  Yes, there are all these tie-ins to data and sampling algorithms and a bunch of other functionality has been added to it as modules and blah, blah, blah.  But its all basically – how can we allow IT folks to see what is going on in their network better.  When you boil that down, the thing that everyone loves about DDOG is essentially a workflow and a GUI.  That’s it.

Now it appears to be an extremely good workflow and GUI.  No question there.  But there is no magic here.  Watch these videos.  Go and search DDOG in youtube and watch the other customer videos.  They make it pretty clear what the product does.

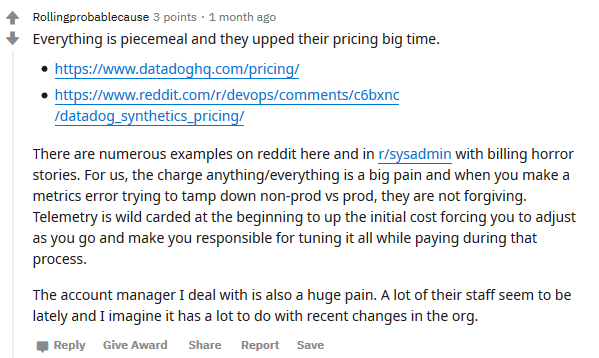
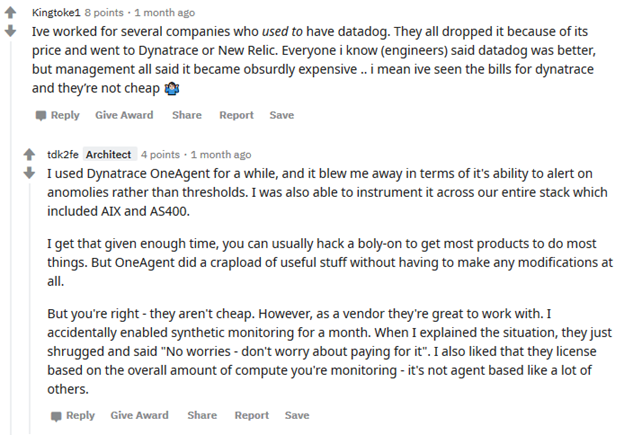
Meanwhile, as you will see below, DDOG is VERY expensive.  IT guys are complaining about the price left and right.  I point it out below.  When I read the cost/host I thought it was ridiculous.  I know how cheap IT guys are.  They are always chintzy on spending money.  There is a point where IT balks at 5-6-(7?) figure DDOG bills for monitoring.  I certainly don’t think the TAM is what DDOG says it is if they are getting to a TAM by assuming every instance and host gets wired up to DDOG at current pricing.  No way that happens.

The other thing about DDOG is this is niche.  It appears to be a very large market because they can multiply hosts by ARR and get a massive number.  But there are probably a handful or two of people in each company that actually need to look at this sort of monitoring data on a regular basis.  Contrast that with a TEAM – they have a model where their TAM is the number of DEV/OPS multiplied by their sub price per user.  Their users are all using the product every day.  And the users are the entire DEV/OPS team.  That is really different, if you ask me, than a TAM that is a far fewer number of IT admins that are actively deciding how much they want to spend to monitor their hosts.

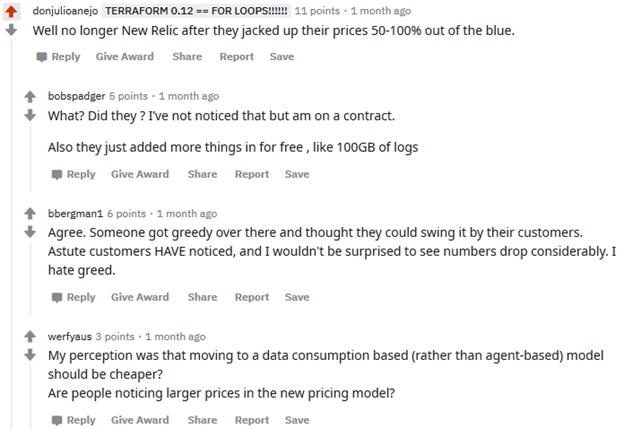
I just don’t think this lasts.  At some point a smart IT admin is going to say – hey I can cut $50k out of my budget if I move from DDOG to this or that or just bring it in house. I think you see this already.  DDOG customer growth is less than half their overall growth.  So much of their growth is existing customers growing their instances of DDOG – or, if you believe some of the horror stories from reddit, getting gouged on pricing from unrealized monitoring that they are billed with.

Not surprisingly, NEWR reduced pricing and added a freemium layer.  I’m sure they realize that DDOG has an Achilles heel in their pricing.  I wouldn’t buy NEWR on that – it seems to me to have its own problems, but I also bet it starts making more IT guys ask – is this really worth it?

Of course to some it is.  It sounds like a great product.  Great graphs, easy to integrate, slick to use.  But I don’t buy that a great experience is worth this kind of multiple.  The moat here is way smaller than investors think it is, IMO and some of these competitors, or maybe some new start-up, is going to take advantage of that and start taking share at some point.


  • founded in 2010
  • 1,403 employees
  • cloud native, SaaS platform addressing observability – monitoring cloud technologies
  • offers “single pane of glass” view of IT cloud environments
  • they break down silos between Dev and Ops
  • their initial use case was infrastructure monitoring, from there expanded to APM and logging
  • now added network monitoring, synthetics, security monitoring

Customers

  • 12,100 customers as of Q220
  • Had 8,800 customers as of Q219 – so customer growth was 37.5%
  • Have 1,015 large customers, up from 594 yoy
  • large customers are those with $100k or more – these are most of the revenue
  • has net retention rates above 130%
  • most customers adopt multiple products – 68% of customers have multiple products, up from 40% yoy

Product

  • an event stream to see what has been going on in your environment
  • so you tie in your hosts and integration by installing your agent into each
  • then you create dashboards to see operations of each host and integration
  • two types of dashboards – screenboards and timeboards
  • can choose what hosts or integrations you want to show on the dashboard, what metrics, etc
  • the graphs that you can create are quite detailed, very customizable, queryvalue maps, hostmaps. etc
  • they have integrations to tie in a bunch of different
  • functions – surface the relevant data you are collecting – transform the data with stuff like absolute value, log function, interpolation, divided by time
  • notifications – get alerts – two types, desktop, emails, but also can add to snap, PD, ServiceNow, Zendesk
  • can send notifications in a comment for any event in event stream
  • use monitors to send notification when some metric is triggered
  • collects metrics every 15s or so
  • I’m surprised the TAM for this is so large?

Pricing

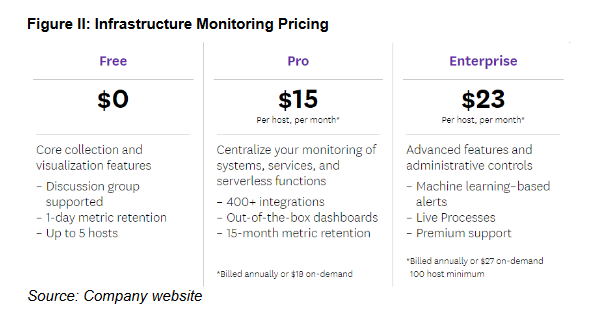
  • they have a freemium model, with a low end first tier
  • model is on pay per host/application base – you pay for each instance that you monitor with DDOG
  • it seems like they charge a lot:

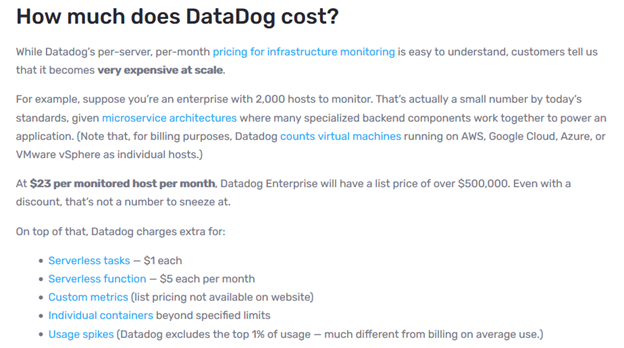
  • $23/host/month seems expensive
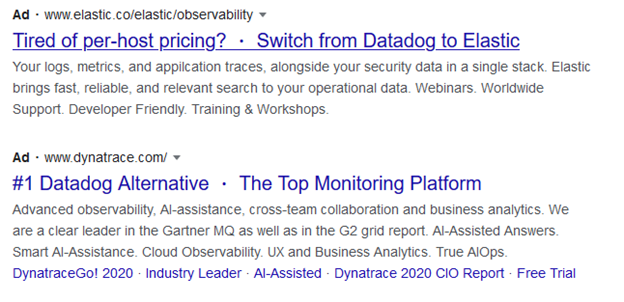
  • when I type in “datadog expensive” into google these are the two ads I get:

  • another site making the point:

  • their application performance monitoring is expensive as well: APM list  pricing  starts  at  $31/host/month  and  app  analytics  list  pricing  is  for  $1.70/million analyzed spans/month.
  • Competition
  • compete against Dynatrace, which has a cloud based service with similar functionality, and New Relic, which had an on-premise solution that they are offering now at a cheaper price
  • NEWR is offering a free tier that they say would cost $10,000 with competitors
  • but they changed tiers – reduced from 11 SKUs to 3 SKUs, results in some prices going up:

  • NEWR is definitely decelerating – growth rate was only 15% last quarter
  • DDOG has revenue retention in the 130% range
  • this is an interesting take:

Despite all the buzz on Datadog, New Relic still has an entrenched presence in the infrastructure/application monitoring space as one of the original vendors, and though Datadog is gaining mindshare that doesn’t mean the space isn’t still new and greenfield enough for two big players By next fiscal year, Wall Street consensus expects both companies to be at a similar scale (~$750 million in annual revenues), but Datadog is now trading at >8x New Relic’s market cap. Despite New Relic’s lower growth, both New Relic and Datadog are cash flow positive

  • also Datadog has “shady pricing”:

  • the problem is, their product is basically just a GUI with a bunch of hooks into other apps/hosts to sample data – this is not some crazy IP that can’t be replicated

Research: HubSpot

I primarily started looking at HubSpot to compare them to SharpSpring.  I spent a bunch of time going over youtube demos of their product.  Its fine, it looks clean and easy to use.  It doesn’t blow me away to be honest.  Its like a lot of these SaaS products.  I read the WallStreet research and you’d think these companies are changing the world. Then I step through the demos and its like ehh, ok.  I mean I worked in software 10 years, this stuff isn’t rocket science.  But whatevs.

The bigger, more interesting thing I found is at the end of the post.  I bolded it.  I’ll do another post later because after noticing this with HubSpot I dug into a bunch of other SaaS names and drew the same conclusion.  But just as a teaser to that, since HubSpot is where I really clued into what seems to be going on, check out the chart at the end of the post showing how HubSpot stock has moved and just how much analyst estimates have changed since the beginning of the year.  Its crazy.  We’re told how these software businesses are booming.  Are they?   Or are the stocks booming and the software businesses are doing fine, but nothing really any better than they were when the stocks were 50% lower.  There are exceptions like Zoom or Shopify but most are not.

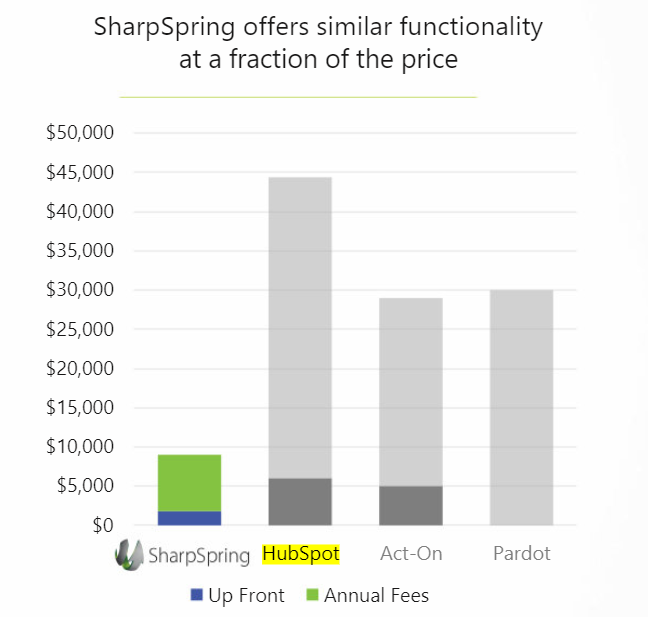
Just as a short conclusion: I’d say the HubSpot product looks better than the SharpSpring one.  You watch the SharpSpring demos against the HubSpot demos and its not quite as clean, things are labeled a little clunky here and there, not as much functionality, and you can see how the workflow isn’t as slick.  But on the other hand, SharpSpring is like 1/5th the price.  From what I can tell its not 1/5 of the package.  I can see why SharpSpring has a easier time getting the agency business.  These are customers that I imagine already know what they are doing. They know marketing.  They do this for a living.  So they know what they want and SharpSpring delivers that functionality at a fraction of the price.  Maybe if you don’t know what you are doing and you need some hand holding or want specific customization to your business then HubSpot is going to be better – I mean it really seems like a more intuitive, better package.  But again, its not that much better.  At least from what I can tell.

General

  • $12.5b market cap – stock is at $284 right now
  • $1.13b of cash
  • $467mm of debt

  • trades at 14x P/S
  • grew 25% yoy in Q220
  • ranked #1 company to work for on Glassdoor
  • their annual event that SharpSpring mentions is called Inbound – 26k registrants in 2019

Customers

  • leader in smaller businesses
  • focus has been small business (organizations less than 2,000 people)
  • could cause elevated churn though
  • have 25k customers that are 2-20 employees – this segment grew 150% yoy
  • enterprise with 200-2000+ employees has 8k customers
  • 25k customers that have multi-products
  • total of about 68k customers
  • because they are targeting small busines, their TAM is 100s of millions of businesses)

Competition

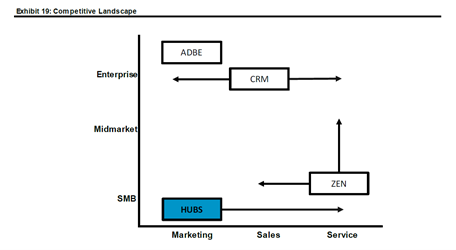
  • they have avoided competition by focusing on smaller end of midmarket
  • they don’t even mention SHSP as competition:

Product

  • began as an app, becoming a platform
  • Marketing Hub is oldest product
  • Marketing Hub puts all of the marketing activities/campaigns in one spot, accessible to sales and marketing depts
  • CRM – contacts tab
    • contacts page, list contacts, filter contacts
  • conversations
    • support emails
    •    chat logs
    •  creating email/conversation templates
  • marketing
  • this is a good video explaining the product https://www.youtube.com/watch?v=sxOibuTUGjQ
    • ads – can connect google/facebook ads, track engagement
    • email – create marketing emails, set up, automate and schedule marketing emails, analyze success of email campaigns based on open rates, click rates
    • social – link all social media accounts in one spot, schedule SM posts, monitor activity
    • website – create static websites in your domain (home page, contact), landing pages for inbound marketing – to download content, fill forms, blog pages – has things like templates for landing pages, web pages, its actually a little web page creation tool, geared to creating CTA pages
  • sales – this is in large part their CRM platform
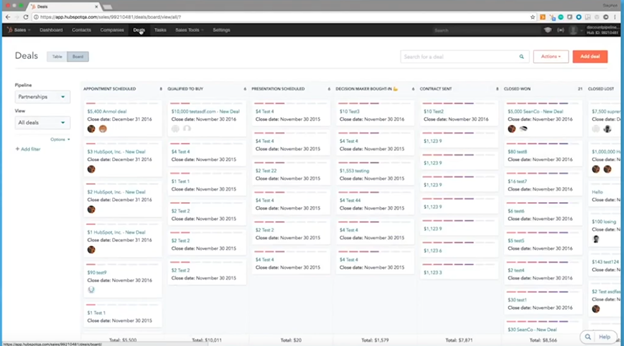
    • deals – set up a deal flow, appts, proposals stored, who decision makers are
    • tasks – lists of sales tasks assigned to you
    • documents – hub for finding documents, also shows stats around document usage/views
    • meetings – set up your sales meetings, connect to Google or Office 365 calendar
  • here is what the deals page looks like:

  • service:
    • tickets are listed
    • service hub dropdowns
  • automated:
    • workflows – automated workflows for your organization, example I watched of an email nurturing sequence, sending sequence of emails of a contact that has shown interest via some form they filled out – fill out triggers of the automation, the emails you want sent out, timing of those emails, etc
    • sequences – stuff like send an email, call two days later, sequence of followup events
    • this was a good video describing: https://www.youtube.com/watch?v=sIEnM0YyM5M&t=444s
  • reports:
    • see traffic analytics
    • performance of ad campaigns
  • CRM
    • I’m not sure if HubSpot integrates with other CRMs or if you have to use their CRM
    • tracks contact management
    • deal and task management
    • interactions with social and email to track leads
    • good video demo: https://www.youtube.com/watch?v=zv2QXavTvH0
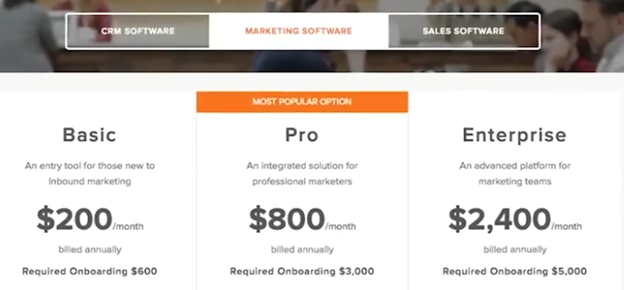
  • pricing:

  • the CRM software is free
  • was originally a tool for SMB – a simple platform to track marketing campaigns
  • originally built around inbound marketing – also called content marketing

  • offer a free CRM product, cheap starter for marketing, sales, service hub:

  • between the three hubs:
    • Marketing hub – $530mm of ARR, growing low-mid 20%s yoy
    • Sales Hub – $100mm ARR, growing 100% yoy
    • Service Hub – $14mm ARR, up 5x from ~$2m a year ago

Growth

  • a few years ago they changed go-to-market by embracing free CRM
  • their growth has been primary a function of customer count
  • ARPC has been declining
  • ARPC metric is a bit deceptive – enterprise spend per customer is increasing, starter products are bringing down overall spend per customer
    • Marketing Hub growing at 5% yoy if you exclude the starter product
    • Sales Hub growing at 31% yoy
  • international revenue has expanded faster – 60% CAGR over last 5 years
  • fcf margins are ~10% and growing:

  • more evidence that their growth is based on sub adds. Their retention rates are not that high, hovering around 100%

  • revenue in the US is slowing a little – was 26% in Q319
  • core marketing ARR is in low-mid 20s
  • these were the Wells Fargo numbers heading into Q419:

  • whats interesting is that the FY20 average estimates are essentially the same as that, actually a little less on EPS:

Q2 Results

  • had set a low bar
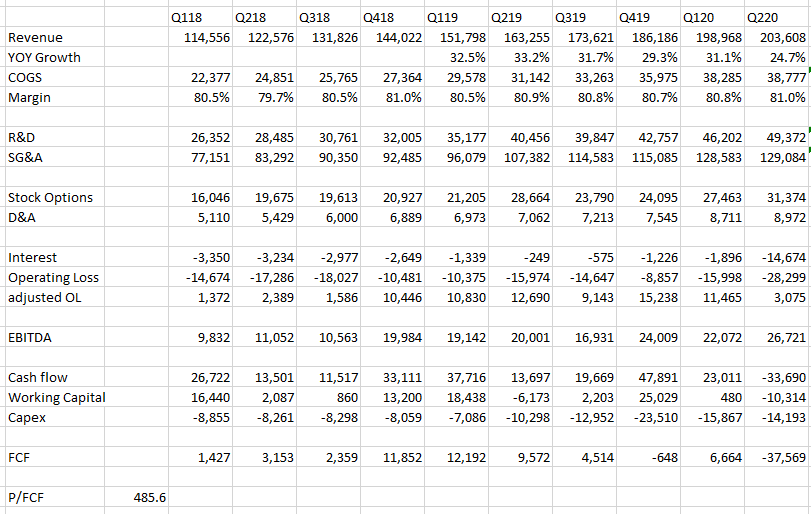
  • revenue was up 25% to $204mm – this compares to 31% yoy growth in Q120 and 33% yoy growth in Q219
  • positive surprise on customer acquisitions
  • they had lowered the price of their Starter Suite by 2/3 in Q120 which drove growth in customers
  • total customers grew 34% – 7,896 new adds vs 4-5k new adds last quarters
  • the promotion could lower revenue growth over next 12 months – it is extended to Q320
  • billings was up 20% yoy
  • there was 400% increase in suites install base – due to free user upgrades and new businesses moving online
  • avg sub revenue per customer was down 5% yoy though
  • guidance of 23% revenue increase – up from 19% before – $210.5mm at midpoint
  • here’s the funny thing about Hubspot, while the stock has shot up to new highs, its not really based on any increase in estimates, estimates went down and then came back up again and are basically still below where they were:

  • So really take a look at this chart.  This chart is not just showing 2020.  Its showing 2021 and 2022 estimates as well.  So we are looking at changes to analyst revenue forecasts for next year and the year after.  And, um, they have hardly changed.  This is the big “pull forward” in software adoption?  Really?  Because it looks pretty damn flat to me.  The stock is up a ton.  But the forecasts – not so much.
  • their poor cash flow in Q220 is kind of weird – everything yoy on the income statement looks comparable to Q219 but for some reason they burned through $23mm of cash before working capital.
  • the only thing I see on the cash flow statement is this repayment of convertible:

  • I wonder if that shouldn’t really be subtracted as an operating activity?
  • Its really strange to me that Q220 cash flow was as bad as it was given results are basically similar yoy (and they are growing of course)

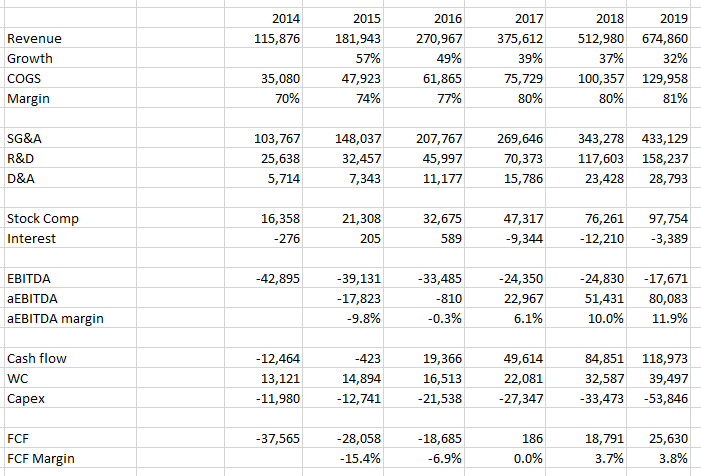
  • what strikes me as well is that in the last 5 years their top line has grown 6x but really their EBITDA loss has only shrunk like by like $25mm.  And if you want to argue that its because of the sub-growth – that MS argument that growth is masking true profitability, then why don’t we see EBITDA improvement accelerating as their growth rate goes from 57% down to 32%

Research: SharpSpring

Marketing Automation

  • marketing automation is really about driving leads and sales and revenue for our customers
  • enables them to drive more leads and sales at a time when converting every lead possible into a sale
  • help along the entire sales funnel
  • With regard to the value of marketing automation, marketing automation is really about driving leads and sales and revenue for our customers.
  • Even in a pandemic situation, SharpSpring enables them to drive more leads and sales at a time when converting every lead possible into a sale matters more than ever.
  • enables them to optimize their entire marketing and sales process, enabling them to understand what’s working and what isn’t and eliminate the things that aren’t working and double down on the things that do.
  • the TAM, the total addressable market, is massive when it comes to marketing automation
  • estimated to grow by folks like Gartner and the rest to $14 billion by the end of 2014 — or excuse me, ’24

Legacy Alternative

  • just beginning to see the adoption as people get frustrated with managing all of these point solutions that were never designed to work together, that don’t include the automation or any of the tracking
  • at the beginning of the industry’s — or the world’s adoption of marketing automation
  • A CRM system, a landing page builder, a forum builder, a social media management platform, an analytics package, an e-mail package, all of these things don’t work together well and create a very brittle marketing technology stack.
  • Marketing automation solves that by incorporating all those technologies into an integrated solution that is wrapped around a core technology

Product

  • we had a very weak product
  • We launched in 2014
  • we launched with a hugely disruptive price point
  • offer our services for as little as 1/10 the cost of a comparable solution
  • core technology is an integrated database
  • and a core tracking technology that today will track literally billions of clicks from our agency — or excuse me, from our customers, every one of our customers’ websites, every visitor to every one of our customers’ websites and every click on an e-mail or landing page or website runs through our rules engine
  • rules engine is the core technology of a marketing automation platform
  • Form builders, landing page builders, e-mail marketing, social media management, chat bots and the list goes on – wrapped around this core tracking technology
  • the rules engine that makes all of marketing automation possible is really the stuff of computer science textbooks
  • pulling off a marketing automation solution is incredibly hard. It’s really 20 products at this point rolled into 1
  • any click could tick off an automated event such as increasing a person’s lead score, a lead score, sending an e-mail or Drift campaign to that lead, notifying a salesperson that a lead has changed status and is now worth working on
  • top-rated platform by every major software review site that’s out there, G2 Crowd, Software Advice, Capterra
  • Nearly all of our revenues are SaaS business.
  • 7:1 LTV to CAC ratio
  • lifetime value, we believe, is — for an agency partner is north of $50,000
  • During the COVID time period, we’ve been acquiring customers for south of 10,000 rather than 7,400 as represented here
  • are acquiring customers that we think are actually now worth just north of $50,000

Customers

  • SharpSpring competes is in the SMB and mid market
  • 85% of our revenues flow through digital marketing agencies
  • have about 2,000 agencies that we think of as our customer, but they act a lot like resellers
  • agencies serve essentially as augmenting an internal marketing department or is a completely outsourced digital marketing department for the SMBs that hire them
  • these agencies typically have between 5 and 50 employees and have many clients – between 10 and 100 clients
  • No single client represents more than 1% of revenues and the vast majority of clients represent less than 0.1% of revenues.
  • have thousands of clients
  • their low price point – have not found ourselves on the menu when companies look to cut back in an effort to save costs.

Revenue

  • revenue model, there’s really 4 parts to it
  • First and foremost, we want to land new customers – means landing new agencies
  • that leads to our expansion potential within each agency
  • core mission is to expand within the agency, to get the agency to move from 1 client to 2, 3, 4 on up to 5, 10, 15. Our largest agency has over 100 clients
  • fourth is pricing power
  • are, far and away, the low-cost leader in the space
  • ability to increase our prices significantly over time without fear that agencies would — or excuse me, clients would move in a different direction
  • are literally 1/10 the cost of most of these solutions, but for a product that is every bit the equivalent of what they offer
  • in order for competition to come down to compete with us, they would cannibalize themselves
  • first 3 categories are what it’s all about for us, expanding the number of clients within each agency and giving them more products and providing value that way
  • Beyond that, we can cross-sell and we can up-sell
  • one of the things that people don’t understand about our business, we have high logo attrition
  • see the heaviest attrition taking place in year 1 and are focusing on executing within that year time frame to become a more sticky platform
  • can sign up on a monthly agreement and pay a very small onboarding fee to get started with SharpSpring
  • no clear way for us to tell which agency is going to take off and add 15 or 20 of their clients to the platform and which agency is going to fizzle out after 6 months in a trip
  • reported a 99% year-over-year net revenue retention number prior to COVID
  • this last quarter, we reported roughly 92% revenue retention
  • backdrop of 3% logo attrition on a monthly basis, so very high comparatively logo attrition
  • only ever lose low-value agencies
  • those characteristics, including the higher logo attrition, is built into our lifetime value calculation, which is north of $50,000

Recent Financials

  • latest guidance, which is around $30 million of revenue
  • We are continuing to grow healthily despite the pandemic conditions and have really never been more stable as a business than we are today.
  • I need to — this slide does not gel with our latest guidance, which is around $30 million of revenue.
  • We’ve also increased our cash position and are at around $15 million of cash on the balance sheet as of this point and made significant strides this last quarter towards both cash and EBITDA breakeven.

Competition

  • competition is same as its been for years
  • we compete with exactly the same companies that were on my business plan from 2011 before I started our company: HubSpot, Marketo, Salesforce, Act-On and Pardot
  • Adobe just purchased Marketo last year, I believe, for $4.5 billion
  • compete and win every day versus HubSpot, Act-On, Pardot, which is now part of Salesforce
  • compete with Marketo on occasion
  • we aren’t up at the enterprise space, which is mainly where Marketo exists
  • smaller companies better served by companies like Mailchimp and Constant Contact
  • they are leader in agencies – HubSpot has long since stopped reporting on their agency count – last number we’ve ever heard from them at 3,000 agencies
  • other companies were the first movers in the space. They certainly have much, much higher price points and that serves them well
  • competition has built up cost structures around those price points, have field representatives
  • HubSpot does an inbound conference every year that, I believe, costs them something like $20 million
  • if you go to any one of these software review sites, which are effectively the analyst for SMBS, right? SMBs don’t really go to Gartner. But they do go to Capterra, which is a Gartner site and look for reviews. And our ratings there and the number of ratings and the brand awareness is really started to pick up a little bit and we’re included in more bake offs, and we’re attracting a little bit larger agency, which is sort of exciting for us

Perfect Audience

  • acquired in Q4 of 2020
  • acquired substantially all the assets and assumed certain liabilities of the Perfect Audience business unit from Marin Software Incorporated, a Delaware corporation for cash consideration of $4.6 million
  • Perfect Audience platform employs a usage-based revenue model
  • Perfect Audience platform acquired in November of 2019 generated an additional $0.62 million of new revenue for the three months ended March 31, 2020
  • retargeting and digital ad platform and we can bring those types of products to customers – basically an advertising platform
  • allows a business to put all of their ads in one platform and yet advertise across dozens of digital ad networks including Google’s digital ad network, Facebook; Instagram; Smaato; OpenX; Rubicon, which is now, I believe, Xander — no, excuse me, the Rubicon Project, different company; Yahoo; AppNexus
  • Perfect Audience experiences a much quicker cash turn than our core SharpSpring business. Processing higher volume, lower fee transactions
  • estimate that the lifetime value of a Perfect Audience customer could be around $1,500
  • believe we’re acquiring customers for about $475
  • payback period on those dollars is just a couple of months, which allows us to recycle those invested dollars at very high velocity
  • been steadily building this product into SharpSpring and believe it will offer us some real cross-selling and upselling potential
  • Sharpspring integration focus has really been about making significant changes in the customer acquisition process and working to increase lifetime value by helping customers better spend our budget through look-alike audiences
  • use it to drive quality leads into the top of the funnel
  • June was the single highest revenue month since the acquisition

Q2 20 CC

  • 276 new customer wins we secured during the period represent approximately $2.2 million in annual recurring revenue
  • approximately 2,000 agency customers and over 500 direct customers and over 8,500 total businesses
  • CAC up due to COVID: cost to acquire customer was approximately $10,900, which was a sequential increase from $9,800 recorded during the first quarter of 2020
  • this quarter’s CAC calculation artificially reflected pre-COVID-19 sales and marketing spend as a numerator and COVID-19 adjusted new deal closing as a denominator
  • our marketing spend is down considerably in Q2, but we’re still expecting to see similar sales levels going forward, which should lead to significantly lower CAC next quarter and beyond
  • Q2 2020 net revenue retention was 91.6%. On a monthly basis, second quarter 2020 average net revenue retention was 97.6%
  • firmly believe that we will see a point in our relatively near future where we hit a 100% revenue retention
  • reduced expenses due to COVID: deliberately reduced our expense budget based by nearly 20%, which is expected to create significant cost savings for the remainder of 2020, and should also allow us to meet our target cash usage for the year of approximately $4.8 million
  • put some austerity measures for lack of a better term in place as the pandemic hit
  • Most of the changes that we put in place, we believe, to be permanent changes
  • did do a salary reduction
  • asked people to take a 10% reduction in salary
  • During the first half of the year, we spent approximately $3.5 million of our $4.8 million 2020 full year projection
  • expects total revenues between $29.5 million and $30.5 million, which would represent an increase of approximately 32% compared to the prior year – some of this growth is from Perfect Audience though
  • range of total revenue is driven in large part by our Perfect Audience revenue through the second half of the year
  • recorded a 38% increase in the number of paid advertisers compared to the first quarter of 2020
  • actually sold, I want to say the number is 2 or 3 more agency partners than we did last year
  • 80% of the businesses that we sold in Q2 were agencies and then that, of course, is where the 10 packs came from.
  • seen agency client expansion slow down
  • not seeing agency clients leave agencies very much at all
  • many other players in the space are experiencing major drops in the advertising revenue
  • as the economic conditions improve, we’ll see greater acceleration of the business
  • as the low-cost provider in the space, we are also insulated from companies seeking to lower cost by switching to more cost-effective solutions.
  • introduced a new pricing option for larger agencies that allows new customers to buy more licenses upfront at a nominal discount in exchange for an annual commitment
  • saw strong interest in this new option from larger agencies and sold a total of 10 bundled, $1,500, 10 pack licenses, one of which was actually a 40 pack.
  • in addition to signing up at a much higher initial MRR point from, typically what is a $600 sign up starting out at $1,500, in addition to that, they are on an annual contract. So these are customers that are not only paying us more MRR, but are more stable customers and more committed to putting a lot of clients on the platform
  • these larger clients that takes a 10 pack and you’re getting the $1,500 kind of as it is
  • would then be charging for expansion licenses I believe it’s $275 million for an additional license after the 10 pack
  • these are larger customers that believe that their 10 pack is just the start
  • new agency customers were actually up year-over-year for the second quarter.
  • larger deals resulted in a 10% increase in ARR from $2 million in Q2 of 2019, to $2.2 million in Q2 of 2020
  • Chip House would be joining SharpSpring as our new Chief Marketing Officer
  • credentials at high-growth SaaS operations
  • was the first marketing executive at Exact target and early SaaS pioneer
  • also led marketing efforts for e-commerce provider, Digital River

Springboard

  • our new engagement platform, which we’re calling SpringBoard
  • products have become so powerful that most customers only use 20% or 25% of the entire tool set
  • proactively building an in-app engagement tool called SpringBoard that is designed to provide a customized plan to a user, enabling an agency or their client to know precisely what to do? Why to do it? And when to do it?
  • SpringBoard’s unique value proposition is that it doesn’t just teach a user how to use the platform, but acts as a business’ own strategy consultant advising you on how to extract the most value from the platform.
  • customized stats to show a promise land
  • concrete tailored guidance on how to get there
  • gamified the process to track progress and unlock certification and merchandise rewards

Longer-term Financials:

Recent Financials