Skip to content

Letter 31: Bank earnings and more bank earnings, lightening up on gold stocks (again) and a soon to come Canaco Magambazi resource

Portfolio Performance:

Portfolio Composition:

Waiting on Magambazi…

I have been working most of the week on an evaluation of Canaco’s Magambazi deposit in Tanzania. I was hoping to be finished the work by today but its carrying on and I don’t have a lot of time to finish it today (what with the superbowl and all) so this will be a rather short update, but with a longer, hopefully rigorous analysis of the Magambazi deposit will follow shortly tomorrow or the next day.

Outperformance of the US

Now that is something that I haven’t said in a few years.

While it was another good week for the S&P and a decent week for my portfolio it was not a great week for the TSX.  Again.  This is becoming a pattern.  Its striking how badly the TSX is underperforming so far this year.  The S&P is up almost 6%, the TSX is up hardly at all.

I have tried to increase my positions in the US-sensitive stocks I own to take advantage of this American out-performance with a particular emphasis on leverage to the mortgage industry.  Most recently, in the last week I added to my positions in Community Bankers Trust, PHH Corporation and I introduced a new position in Rurban Financial Corp.

Rurban Financial Corp

Rurban was  recommended in a comment (by Robert) to my post last week.  I did a quick look at the company, which released 4th quarter earnings on Monday, and they do indeed look cheap.  And while I haven’t had a chance to take a close look at their prospects, I’d liked what I saw on the surface, so I bought a small starter position.

The company produced earnings ex a one time merger charge and ex OREO losses of 23 cents per share in the 4th quarter.

Now I admit I have not dug into Rurban to the point that I need to (this Canaco resource estimate has been all consuming of my spare time).  I plan to do that in the next week.  I’d like to put together a comparison of Rurban and Community Bankers Trust and perhaps Bank of Commerce Holdings (both of which I will touch on below) side by side to better evaluate Robert’s legitimate skepticism in BTC.

Community Bankers Trust 4th Quarter Earnings

And speak of the devil, they released 4th quarter earnings on Tuesday.  I thought the numbers looked pretty good. The quarter was summed up by the following statement from CEO Rex L. Smith III:

“Our goals for 2011 were to make major improvements in our problem assets and to rebuild the fundamentals of the core bank, and I am pleased to report that we accomplished our goals. Both nonaccrual loans and net charge-offs saw continual and substantial declines throughout the year. At year-end our ratio of nonperforming assets to loans and other real estate was at its lowest level since the first quarter of 2010. Additionally, the fourth quarter showed a strong increase in new loan production in our targeted growth areas. All of this occurred while we lowered noninterest expense for the year by 21%.

Let’s step through some of the key metrics and update the graphs I showed last week with the 4th quarter numbers.

Pro-forma earnings (that is earnings before the FDIC amortization and before any one time hits to investments and real estate owned) were strong in the fourth quarter, coming in at 14 cents per share.  Again I think the bank has a lot of earnings power going forward once (if) it is able to bury its past misdeeds.

Equally important, nonperforming loans were down again in Q4.

The only negative I saw for the quarter was something I have seen a lot of with the banks reporting fourth quarter results thus far.  Net interest margin is on its way down.

Banks are struggling with the headwind of low interest rates.  Basically,  purchasing non-risky securities (ie. Treasuries and government backed MBS) means accepting extremely low returns.  As older securities mature and roll off the books they are being replaced by low yielding new securities.  Of course this is exactly what Bernanke is looking for to try to get the banks lending again.  That seems to be working in the case of BTC, as loans originated was up in Q4.

Bank of Commerce Holdings 4th Quarter Earnings

I wrote a short piece ofter my purchase of Bank of Commerce Holdings about two months ago.  Since that time the stock has risen about 15%, so its been an okay purchase but nothing exceptional.

I have yet to really evaluate the stock in the kind of depth I need to.  I hope to get to that in the next week.  In the mean time I have been compiling the basic statistics to do that evaluation.  The company came out with another data point on Tuesday when they released their 4th quarter earnings.  I would call it a mixed bag.  On the bright side the company showed another strong earnings per share number when you ex-out the one time hits, and ROE and ROA also showed strength on a proforma basis.

Note that my estimates of ROE and ROA exclude provisions from loan losses, losses on real estate owned and one time investment gains so they are somewhat higher than the posted numbers in the news release.

On the negative side the company struggled in much the same way as Community Bankers, posting a lower Net Interest Margin quarter over quarter.

Perhaps more worrying is that nonperforming loans are rising.

I’m not sure about Bank of Commerce Holdings.  I don’t have a large position in the stock.  I don’t love where the bank is based (around Sacramento California) and I don’t like how non-performing loans are rising at all. As CalculatedRisk pointed out recently, there aren’t any signs of things improving in Sacramento yet.

The percent of distressed sales in Sacramento was unchanged in November compared to October. In November 2011, 64.1% of all resales (single family homes and condos) were distressed sales. This was down slightly from 66.1% in November 2010.

I’m going to evaluate it closely and turf it if I don’t see a strong story being written that will lead the company back to the $6+ level.

I need to understand gold better

Early in the week the gold stocks and the bullion looked to be breaking out together and there was a hope (at least in my mind) that it was for real.  Then the Friday employment number came out and presumably frightened everyone about the prospects of inflation and the gold price dropped 1.8%.  Some of the gold stocks got hit much harder.  I’m not willing to find out if this is a blip or another true correction; I reduced my trading positions in Aurizon, Canaco, and OceanaGold (though as you will note at the end of the post with respect to my weekly practice account trades, I mistakenly bought rather than sold OGC.  This is something I will have to rectify on Monday).

What I need to do to gain some lasting confidence in my gold stock position is gain a better understanding of the supply/demand dynamic right now.  I’m flailing a bit here and I’m fully aware of it.  But there are a number of headwinds happening here that I don’t want to ignore:

  1. The lack of Indian demand brought on by the strong rupee
  2. An improving US economy will mean higher interest rates eventually
  3. The ETF has become such a big part of demand and I wonder how much of those holders are “weak hands”

The problem is that while I believe in gold in the long term, I also know that a lot can happen in the interim.  Rick Rule was pointing out a few months ago how in the 70’s and early 80’s, when gold rallied from $35 to over $800, it also had a number of corrections, including one of over 50%.

My lack of clarity in understanding just what is driving gold at the moment (and whether in the short term, particularly given that the seasonality effect is about to turn against the metal, it remains sustainable or not) is leading me to these short term in’s and out’s with OceanaGold and to a lessor extent Aurizon.  Gaining back some clarity, and with it hopefully some more certainty in my decisions, is another endeavour I hope to accomplish in the next week.

Speaking more company specifically, Atna remains the strangest bird of the bunch in the gold stock sphere.  It consistently outperforms (even goes up) on days when other gold stocks are going down and then does nothing (or goes down) when all the other gold stocks are up.  I don’t understand the stock for a second, though I am happy that the trend in the stock is, to borrow the phrase from Dennis Gartman, from the lower left to the upper right.

My soon to be complete Canaco Magambazi Estimate

In a next day or so I will be posting my interpretation of the resource estimate at Mogambazi.  I basically have went through the deposit, cross-section by cross-section, and evaluated the resource using a rough block model.  I thought it would be a fun project, and it has been, but its also been a lot of work.  My tools consistent of Visio, Excel and the screen capture tool snip-it, and my main resource to educate myself has been google, so its been a bit of a process.  Still, I’ve learned a lot and have become developed a better understanding of what Magambazi is (both the good and the bad) which I think will allow me to act prudently on it in the future.

So stay tuned for that.

Weekly Trades

The Canadian House Price Plateau (or cliff?)

I live in Calgary, Alberta.  The house prices here are high by most global standards.  The average sales price of a single family home in Calgary was $453,000 in December.

In Canada, Calgary is nothing special.  House prices in Canada are high.  I stumbled upon the following interesting research by the Demographia International Housing (DIH) that compared house prices across the globe.   Here is what they determined as being the unaffordable locales in Canada.

For those of you unfamiliar with Canada, Fredricton, Thunder Bay and Yellowknife do not represent a “hub” of Canadian population.  Vancouver, Victoria, Toronto and Montreal  do.

The above was taken from the DIH’s Affordability Survey (2012).   The methodology they use is to rank cities based on affordability is to use a ratio of the median home price in the city divided by the household disposable income.  The number gives a ratio, and a ratio of greater than 3 has traditionally been seen as creeping into the unaffordable category.

Whne I read through the report, my first question was, what exactly is household disposable income (HDI)?  From wikivest:

The amount of money that households have available for spending and saving after income taxes have been accounted for. Disposable personal income is often monitored as one of the many key economic indicators used to gauge the overall state of the economy.

In Canada, HDI is somewhere around $55-$65K depending on the source you use to calculate it:

While the DIH provided some interesting city by city numbers, I was able to dig up a Canada-wide number from a recent speech given by Mark Carney.  You have probably read sound bites from this speech before.  In particular the following shocking, over the top, end of the world type pronouncement about the Canadian housing market has been quoted widely:

Some excesses may exist in certain areas and market segments.

These central bankers are fear mongerers!

But not to worry, Carney also pointed out that overall the Canadian housing market is healthy:

Canada’s housing supply is relatively flexible, compared with other countries, and it appears to have grown at rates broadly consistent with underlying demand forces, the most important of which is the rate of household formation.

Of course, in the United States, in the time leading up to their housing collapse, Alan Greenspan and then Ben Bernanke said much the same thing.  One thing I have learned from reading all these books about the 2008 housing debacle in the US is that what a central banker says has more to do with the central bankers ideology is than the on the ground reality.

If you look at the data, you get a somewhat more worrying picture.  Below is canadian house prices to disposable income:

Overall the country is quickly approaching 4.5.  Using the DIH methodology, this would put the country as a whole in the “seriously unaffordable” category.

As for Calgary, with a ratio of 3.9, it is only “moderately unaffordable” (phew), though we are on the cusp of being “seriously unaffordable” (uh-oh). There is a really excellent analysis of how both house prices and household income have grown on the economic analyst website.  They posted the following comparison for Calgary in particular:

One more point about Calgary.   If you look at the median house price that is being used for Calgary by the DIH and others, you would be struck by the fact that it is $353,700 and not $393,000, which is median price reported by the CREB.  The reason for the discrepancy is that the $353,700 number includes  the “surrounding district” which means it includes Cochrane, Airdrie and some of the farming communities surrounding the city (Acme?).  If you include the metro Calgary area only, which is what the local real estate board does when they are reporting statistics (because they like to print higher numbers), it would put Calgary into the “seriously unaffordable” category.  I cannot find data on the area used to calculate the average household disposable income of the city, but I imagine it would be based on tax receipts and thus be restricted to the metro area.

Back to Canada as a whole, price to rents tells the same basic story.

Its either a heck of a bull market or a bubble.

As an aside I was amazed to learn that the price to disposable income in Vancouver is a rather bizarre 10.6.  And that is using a $678,000 median.  If you start using the average home price in Vancouver, the ratio is closer to 15.

Of course none of this has to end until interest rates show some sign of rising.  Right now our househols pays prime -0.9% on our mortgage.  That works out to about a 2% interest rate.  Its rather insane.  Even if we had a $500K mortgage (we don’t) it still be affordable.  Of course if that rate went to 6%, it would be a different story.  Some day that might happen.

Opportunities?

So why am I writing about this?  Well for one, I think its an interesting study.  The Canadian housing market has defied all other housing markets that have crashed and burned in the last few years.   It has also defied most all metrics of affordability.  For all the bears out there that say that the US housing collapse was inevitable it seems a reasonable question to ask: “then why not Canada too?”

I am of the mind that these forever rising prices, particularly Vancouver and Victoria and the inner city area of Toronto, are going to end badly some day.   Everywhere else in the world the 3:1 ratio holds but Canada is different?  The different argument is a big circular one.  Because the different argument inevitably comes down to the fact that Canadians are inherently prudent and would not expose themselves to large risks. Which apparently means that this attitude allows Canadians to take on large risks.  Anyways…

I also bring the topic up as a potential area for short candidates.    Who would be hurt by a price fall?  Particularly Vancouver.

Well first and most obvious is the Canadian banks.  Mortgage debt makes up around 42% of the loans on the balance sheets of Canadian banks.  This number has increased from 31% in 2002.

Another name that comes to mind is Home Capital Group.  The company is always being praised on BNN by some expert making a top pick.  The stock appears to trade relatively cheaply, at less than 10x earnings.  But the business of the company is to make loans to people that can’t qualify for CMHC loans.  I don’t know if the loans they make are “subprime loans” persay, they probably aren’t, but the company fills the exact same niche that the subprime borrowers in the US did.

I don’t know enough about the company to make any more observations than that right now. But it intrigues me.  The company is worth a closer inspection.

And I’m open to ideas.  What other companies could potentially be left with their pants down in the event of a material decline in Canadian house prices?   I think there is plenty of time to gather  more information about this trade.  There probably is not much to worry about until interest rates begin to rise.  And that might not happen for another couple of years.  Please contact me with any suggestions, either by email or in the comments.

Week 30: Cognitive Dissonance, Canaco updates, Canadian house prices and the story of Community Bankers Trust

Portfolio Performance

Portfolio Composition

Trying to not be dogmatic

A few years ago I read a book called Mistakes were Made.  The book described our ability as human beings to remain convinced that we are right to the point where we ignore all evidence to the contrary.

Our predisposition to fabricate reasons why we are right and ignore reasons why we are wrong is based on a concept called cognitive dissonance.  As the book defines it:

Cognitive dissonance is a state of tension that occurs whenever a person holds two cognitions (ideas, attitudes, beliefs, opinions) that are psychologically inconsistent… Dissonance produces mental discomfort ranging from minor pangs to deep anguish; people don’t rest easy until they find ways to reduce it.

All symptoms I am all too well acquainted with.

Along the same lines, I came across an interesting piece on FT this week.  The following quote can be attributed to SocGen’s Dylan Grice:

But all is not lost. The bias towards thinking we’re more correct than we are isn’t driven by an inability to fully assimilate undesirable information but an unwillingness to do so. Therefore, the first step in removing the bias is to adopt procedures that foster a more honest acceptance of logical conclusions. Logic has no emotional content per se. There is no such thing as good or bad information; information is only true or false.

But because of our hardwiring, we only want certain information to be true. In particular, we want the information that confirms our prior beliefs and validates our belief systems to be true — about ourselves, about others, about the world. Thus, debiasing ourselves must involve an honest assessment of what we want: do we want to be right about everything, or do we want to know what’s true?

Let’s bring this back to what this blog is about: investing.  In my piece last week I stepped through the basic premises on which I am currently invested.  The tenants I stated were the conclusion of a somewhat anguished and certainly restless mental reevaluation that I had been running through over the prior few weeks.

As the market moved against me I  started to look at why I might be wrong.  In my spare time I tried to “assimilate the undesirable information” and paint the most contrary picture I could.

I especially went through the exercise with gold and with my rather significant precious metal stock positions (Aurizon Mines, Atna Resources, OceanaGold, Canaco Resources, Geologix, Esperenza Resources, Lydian International and Golden Minerals).  Gold is always easy to question (what does gold really do anyways?).  I attempted to soberly evaluate both the prospects of the metal  and the companys.  I looked for reasons to basically cut them loose.

I hemmed and hawed a lot, and at times began to convince myself that I was indeed wrong.   But in the end I was led back to the basic points of valuation and underlying conditions, which seemed to me to remain firmly in gold’s favor.

This is how I make decisions.  At times it undoubtably appears that I am flip-flopping.  I am sure that my weekly writings must have an aire of contradiction when read one after another.  A reader might wonder how it is that my point of view can go from one extreme to another in the matter of weeks (see Argonaut Gold).  Or at times even flip 180 degrees only to flip back a few weeks later (see Argonaut Gold).

In truth, this is the only process I know of that allows me to really question whether I am right.  If I can push myself to the edge, almost convince myself of the diametrically opposed point of view, and still in the end come back to my original conclusions, then well, that’s really getting somewhere.   At times I push myself so far that I actually begin to believe it myself (ah yes, see Argonaut Gold), but that is just a occasionally necessary casualty.  Far more often I leave the exercise with more clarity, and with that clarity comes the likelihood that I will act properly when the situation arises.

In the end I came away from my “anguished” analysis of gold more confident in my positions than I was when I started.  And this week, on Wednesday, when the Fed news hit the wire that interest rates would be low for time eternity, that gave me the clarity to act.

The moment I read the news I bought a position in Barrick Gold, and I added to my positions in Esperanza Resources and Golden Minerals (though I neglected to make the AUM trade in my practice account).  The next day I added to OceanaGold, and thta was followed by additions to Atna and Canaco the day after that.

In my practice account:

And in my actual account:

You do the work so that you have the confidence to act.  You put in the time learning and working through why so that when an opportunity makes its brief appearance, when Bernanke comes out and says “yeah we aren’t going to raise rates for a long time” you can recognize it for what it is and say “all right, I’m in” and you know what you have to do.

Had I not been stepping through the thesis of why gold and gold stocks remain a solid investment, I likely would not have had the conviction to buy into the rally.  At worst, I would have sold into the rally, because if you really don’t know why you are investing in something you tend to take the first blip after a long period of blah as a “finally I can get out” moment.  As it is, with the Fed putting interest rates on hold for another couple years, and with their actions maybe even foreshadowing a true QE event in Europe, I feel quite confident that I am positioned well for that fall out.

Speaking of Canaco Resources…

I bought Canaco Resources at the end of the year at about $1.10 as part of my “tax loss buying binge”.  A couple of things happened with Canaco this week.

First, the stock went up.

Second, the company updated us on its activities in Tanzania:

  • Expect a resource estimate by the end of March
  • Expect a preliminary economic assessment by the end of the third quarter
  • Expect further metallurgical testing results at some point

Third, Canaccord Capital came up with an updated price target, and more importantly helped give us a glimpse at what to expect from the upcoming resource estimate (hat tip to howestreetbull who posted this on Investors Hub).

  • Canaco has approved a US$35-40 million 2012 exploration budget, and is currently drilling 10,000 metres per month at Handeni with nine diamond drill rigs and one RC rig.
  •  Six of the drill rigs are focused on delineating the Magambazi resource in preparation for the initial resources estimate. Two diamond drill rigs are focused on the Kuta and the Magambazi North Extension targets. The remaining diamond drill rig is operating on the Majiri target, where previous surface sampling and RC drilling indicate a gold anomaly. The RC drill rig iscurrently operating on the Bahati target to test preliminary regional targets.
  • We are expecting an initial resource and metallurgical test results in Q1/12, and a PEA in Q3/12. We are expecting an initial resource of 2.3 million ounces of gold at a grade of 3+ g/t gold. Previous metallurgical testing indicates recoveries of 90+% using a conventional CIL process.

Valuation: with US$110 million in cash, we believe the company is in a strong position to continue to derisk and advance the Handeni project. Our peak gold price estimate of NAVPS (10%, US$1,750/oz) remains unchanged at $7.50. We continue to value Canaco based on a 0.65x multiple to our peakgold price estimate of NAVPS.

At the current price of $1.50 Canaco trades at a market capitalization of $300M.  Subtracting the current cash balance of $115M, the enterprise value of the company is a little less than $200M.  If the deposit does indeed contain 2.3M oz of gold, the valuation being given for those ounces is about $80 per.

This is a 3 g/t open pittable deposit that looks to be 90% recoverable with a straightforward metallurgical process sheet.  In my opinion (and apparently Canaccord’s as well) those ounces should be worth more than $60/oz.

To throw out a comparison point from a recent PEA, Prodigy Gold had a PEA done for its Magino gold property last March.  The PEA assumed a CIL recovery process, a 9 year mine life, producing gold from an open pit at a grade of 1.2g/t for 9 years to give a total mine of life production of 1,585,000 oz of gold.  The after tax NPV5 of the project was estimated at $259M at $1000/oz gold.   That works out to a value of $160/oz.

Albeit there may be better comparisons out there, but this one surely suggests that Canaco is undervalued.  Canaco’s Magambazi project is much higher grade than Prodigy’s (3g/t versus 1g/t).  The location is Africa, versus Canada for Prodigy, which probably suggests a bit of a discount against Canaco but not enough to make me change my opinion.  And while the Magambazi strip is as yest unknown,  the Magambazi deposit appears to be around a hill top, which should lead to a reasonable number (the strip for Prodigy’s Magino is 3.3).

Finally, the last bit of news was that Brent Cook came out with the following plug about Canaco:

“The funds were just jumping in on this thing – and they all bailed out as well – the stock got down to $1.20. During this time period they’ve been drilling and drilling and drilling, and the results continue to show me that they’ve got what I think is going to be a legitimate, decent size, decent grade, open-pittable deposit in Tanzania,” Cook says. “So we’re buying this stock at $1.30 with $115 million in the bank, and a $41-million exploration program. That, to me, seems like a good buy.”

Yup.

When the gold price broke out on Wednesday, Canaco was the first stock I added to.

and speaking of gold…

I came across this interesting piece of information regarding the appetite of the Chinese for gold.   This may be old news to some but I think it is still worth reporting.

The People’s Bank of China  research director Zhang Jianhua was cited as saying Monday in the central bank publication Financial News that gold purchases should be ramped up when prices drop, although he gave no indication of what proportion of the nation’s $3.2 trillion forex reserve should be allocated to investments in gold.

Apparently, Jianhua called gold the only safe haven left and said that:

“the Chinese government needs to further optimize China’s foreign exchange asset portfolio and seek relatively low entry points to buy gold assets…no asset is safe now.  The only choice to hedge risks is to hold hard currency – gold”.
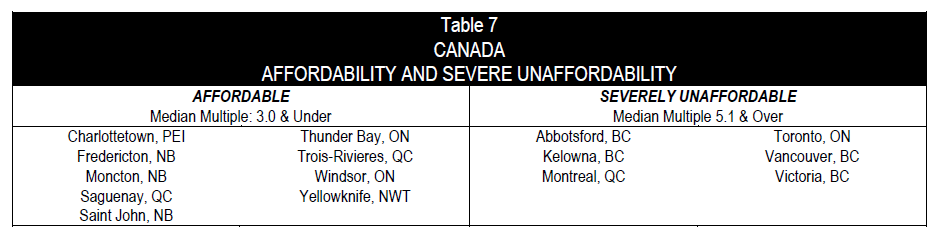
High House Prices

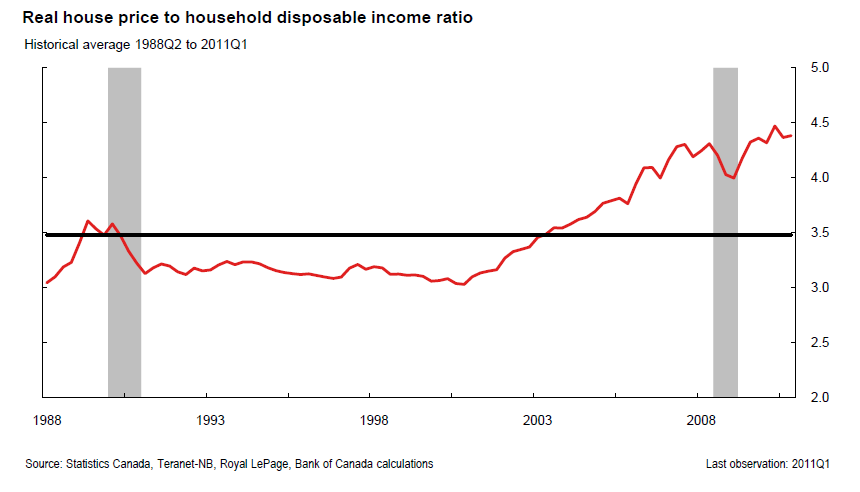
I’ve been doing some research on house prices in Canada and in particular in my city, Calgary.  I plan to do a separate post on my findings shortly, but for the moment I just want to throw up a couple teaser graphs that gave me pause for thought.

The chart is taken from a speech given by Mark Carney to a Vancouver audience last June.  The methodology used is the ratio of the nationwide median home price to the median household disposable income. A ratio of greater than 3 has traditionally been seen as unaffordable.

It makes you think.

One other chart from the same report.  Below is the average house price in Vancouver:

Its either a heck of a bull market or a bubble.  To say it another way, I don’t know about house prices, but when a stock goes parabolic you typically know how it is going to end.

Anyways, more on this later.

Community Bankers Trust

It was a good week for Community Bankers Trust (BTC).

Earnings will come out for the company on Tuesday.  Hopefully the company will put together another profitable quarter.

The BTC story

I bought BTC as a turnaround story.  Community Bankers Trust is a bank that has been trying to reincarnate itself after the first incarnation came close to an early death. My observation is that they have been successfully navigating this resurrection, and with the recent turn in profitability (and a helpful turn in the economy) the bank is on its way to realizing its earnings potential.

The bank was hit hard by the recession in 2009.  The company saw nonperforming loans skyrocket from 2% of total loans in the first quarter of 2009 to 10% of total loans in the second quarter of 2011.  Yet there have been signs that the efforts the company has been making to turn itself around are working, culminating with a profitable quarter in Q3.

Let’s hope they can keep that momentum.

How did they get to here?

The original strategy of the bank was, as far as I can tell at least, to simply buy other banks and get bigger.  Witness, the name of the original company was called Community Bankers Acquisition Corporation  (CBAC), so they weren’t exactly being subtle.  Along with the acquisition strategy, the bank seemed to have a “worry about the profitability later” strategy, which may have worked ok when the economy was growing but that fell flat when the economy didn’t in 2008.

As best as I can discern the acquisition effort was spearheaded by Gary Simanson. He headed up the original company CBAC, and then moved into a position of Strategic Vice President, a position I don’t think I’ve ever heard of with any other company. According to this article, Simanson was responsible for subsequent acquisitions.

In truth, the timing was what killed the acquisition strategy.  To quickly step through the timeline, in May 2008 the company began its journey by acquiring two local Virginia banks, TransCommunity Financial Corporation, , and BOE Financial Services of Virginia, Inc.  In November the bank moved ahead and acquired The Community Bank, which was a little bank in Georgia.  Finally in January 2009 they acquired Suburban Federal Savings Bank, Crofton, Maryland.

So you had 4 bank acquisitions in less than a year happening at the time of a 100 year financial tsunami.  How do you think things turned out?

Change in Direction

By 2010 Simanson had left the company and the direction of the company was changed to the more pragmatic “we need to get profitable before we go belly up” strategy.

This was described pretty bluntly in the 2010 second quarter report. CEO Gary Longest said at the time:

Our strategy has shifted from that of an aggressive acquisition platform, to one that meets the banking needs of the communities we serve, while providing sustainable returns to our stockholders. To this end, we are taking the necessary steps to return immediately to profitability. We are actively analyzing our market base to assess the contributions of all branches to our franchise value and will take the appropriate actions in the third quarter of this year. Additionally, we will make aggressive expense reductions, and will look to restructure and strengthen the balance sheet. We are confident that the analysis of these potential critical paths and the resulting execution of these initiatives will lead us back to profitability quickly.” “Our goal is an immediate return to consistent quarterly profits. To accomplish this, we have no alternative as a Company but to make clear and intelligent decisions in the next 60 days, no matter how difficult, to accomplish that goal as soon as possible. That is our full focus.”

 In a somewhat odd twist to which I’m sure there is a good story, Longest himself was gone only a couple months later. Nevertheless the interim CEO and soon to be permanent CEO Rex L. Smith took up the reins and has carried out the strategy quite well given the circumstances.

 Where are they now?

I already mentioned that the company had its first profitable quarter in a long time last quarter.  I don’t believe this was a one time fluke.  It looks to me like its the culmination of a number of initiatives put forward by the bank that have been geared towards making the bank more profitable.

The company has made an effort to lower the cost of its deposit base.  Time deposits, which are expensive high interest bearing deposits, have decreased from 73% to 67% of total deposits since the end of 2009.  As well, the cost of the time deposits has come down from 2.9% in 2009 to 1.6% in the third quarter.

The effect has been a steadily rising net interest margin (NIM) since the strategic direction change in 2010.

(note that this graph is a simplified version of NIM calculated as a percentage of all assets rather than the more common formulation of interest bearing assets)

The company also undertook efforts to reduce expenses.  The most common way of illustrating the day to day expenses of a bank is through something called the Efficiency ratio.  The Efficiency ratio is simply the ratio of the total non-interest expenses at the bank (so the salaries, building costs, lawyer fees, pretty much everything except the actual cost of borrowing money) to the  net interest margin (so the amount of interest made minus the amount of interest paid).  The reason that you look at the Efficiency ratio is because it ex’s out growth, since growth should occur for both NIM and expenses in concert with one another.

The Effiency ratio of BTC has been falling consistently.

What’s it worth?

To get an idea of what the bank might be worth if it continues to pull itself together, I put together a proforma earnings estimate.  I stripped out all the provision for loan losses, the FDIC intangibles (from their earlier acquisitions) that the bank is required to amortize, as well as losses on real estate and gains of the sale of securities.  So basically I looked at the banking skeleton that is BTC.  Here is what I found:

What this clearly demonstrates is that if get rid of all the scabs, there is quite a profitable little enterprise here.

Meanwhile, the bank sports a tangible book value that is much greater than the current share price ($1.40 after last weeks run up):

What is left to be done?

The story that still needs to play itself out is the healing process.  The really big negative for the bank is that it still has an extremely elevated portfolio of non-performing loans.  There are signs that this is abating, and in truth part of the bet here is the same one that you make on any regional bank: the US economy is turning the corner, the Fed is not going to allow it to fall into another recession, and so the worst of the loan defaults are behind us.

But just to get an idea of the risk here, typically you wouldn’t want a bank to have non-performing loans in excess of a couple of percent.  Many of the best banks I’ve looked at have nonperforming loans of well less than 1%.  BTC, onthe other hand…

There are tentative signs that the peak has passed, but it will take a few quarters before we know for sure that further write-downs are not coming.

Earnings on Tuesday will give us a lot of insight into the direction of the trends.  I’ll be looking closely at nonperforming assets and the 30-89 day deliquents (which are an early warning of the soon-to-be not performing.  I also will be hoping to see some decent earnings.

What is the LTRO going to do for Europe? And how does it affect my stocks?

I think that the essence of this bullish rally can be summarized by this one chart

Investors have taken to the opinion that the long term financing operations (LTRO) provided by the ECB back in December has removed the risk of collapse in Europe from the table, maybe even for a couple years. It’s all clear to buy stocks.

Investors are of the mind that the LTRO has removed the risk of collapse in Europe from the table, maybe even for a couple years.

As described by Citigroup:

The ECB’s LTROs have succeeded in breaking the negative spiral of rising risk aversion, poor asset performance and forced selling. Money is cheap, and every day, confidence is building little by little, prompting buying. The resulting asset performance in turn raises confidence further. The lack of street inventory implies small shifts in demand have a much bigger impact on spreads than in the past.

I underestimated the effect of the LTRO. I might have recognized that having a liquidity backstop for the banks would be a big confidence builder for the market.  Unfortunately I didn’t.  Whether this confidence can be sustained, well that is a question I hope to look at here.

Things came very close to going sideways

We were on the edge of the cliff at the end of November and early December. No where can these be seen more clearly then by the yields of short term bills of the periphery. While I have put up the chart for the 10 year Italian bond a number of times, I have not focused on the short term bills.  Below is the rather shocking collapse and then restabilization of the 6 month bill in Italy.

The LTRO coincided with a tremendous drop in short term yields.  A lessor, but still significant, drop came in longer term yields.  Equities rose as yields fell and the crisis abated.

Is it sustainable?

Citi doesn’t think so.  In the same note Citi says that the rally is likely mostly based on fumes. The reason?  While QE1 and QE2 stimulated lending (and speculation), the LTRO is not expected to stimulate anything other than bank liquidity.

To put it simply, almost all the big banks in Europe are going through a process of deleveraging.  The LTRO simply helps them through this process without putting undue stress on one another, like the stress at the end of November last year.

FT had a good piece on just what the ECB’s intent is for the LTRO. In it they argue that the ECB did not create the LTRO funding to flood the EU with Euros or to stimulate government debt buying by banks. They did it to “stop a heart attack of bank deleveraging in the eurozone.”  When the LTRO is understood this way, it can be seen that it is more akin to the Fed’s response to the commercial paper crisis in 2008 than it is any QE.

This is an important point.

Providing liquidity directly to banks for operational use, as the Fed did in 2008, has historically not been much of a prop to equity markets beyond an initial, confidence induced, blip. The Fed did all sorts of operations in the fourth quarter of 2008. It wasn’t until it embarked on a true QE in 2009 that the market actually responded favourably for an extended period.

It makes you wonder what the half life is of the LTRO effect.

What are the mechanisms of transmission?

The problem is that the LTRO is a liquidity mechanism and the problem in Europe is not a liquidity problem. As Mauldin pointed out in that piece I referenced last week, europe has a solvency problem brought on by countries that simply aren’t competitive and banks and sovereigns that are overleveraged. QE begins to solve the solvency problem because newly printed money pays off old, otherwise unpayable debt.  But is the LTRO intended, or should it be expected, to do that?   I don’t think so.  Its just a long term repo, or in other words, long term borrowing for the banks with very little restrictions on the collateral they have to put up in order to get the money.

I think that to speculate on the real effect of the LTRO on equities over the medium run, you have to think about the mechanism by which QE causes the market to rise.

So certainly there is a change in market psyche.  QE lifts the spirits of the market.  The LTRO did that too.  I would attribute the rise in stocks over the last few weeks mostly to this effect.

In our current case, there is probably also an element of pessimism that was no longer warranted.  The bank stock in Europe, in particular, had been priced to fail.  Failure was no longer imminent, so a rally had to be expected to reprice a degree of solvency back into the stock prices.

Those two elements are probably the biggest effects in the short term.  At some point though, they are going to wear off, and the market is going to start asking, so what is this LTRO actually doing?   Its this longer term impact where the picture gets fuzzy because I don’t think the LTRO has the same long term effect as QE.

The two main long term (with long term meaning months) effects of a QE program is  that the excess money sloshing around from the QE lowers the cost of funding, entice businesses and consumers to borrow, and it provides banks with the liquidity and capital to make more loans.

The problem is, I don’t see that happening here.  Banks in Europe are in deleveraging land.  Just as would be expected, the evidence is that the banks are taking the money and turning right around to inject it back into short term bills (see that chart of Italian bill rates above).  They want liquidity that can be easily accessed in case their wholesale funding dries up.  They don’t want to make a 3 year loan to Acme Manufacturers, taking on the associated risk.  They already have too much risk on their balance sheet.

This is great for the bill market; rates fall, and it certainly removes the most stressed condition from Q4, but if the money not finding its way into the economy, what good is it going to be for growth?

The Eurozone still isn’t growing much

Back to the Citi note one last time:

Despite a mild winter the European economic data isn’t really improving. Our economists have just lowered their Euro zone growth forecast for 2012 from -1.2% to -1.5%. Spain’s Budget Minister Montoro has just warned the country may miss its 4.4% budget deficit target for 2012. The earnings season has been decidedly mixed, with about 60% of US S&P 500 companies beating to date – much lower than in past quarters.

Access to liquidity just lets banks keep on keeping on for a few more months. Like the Fed operations in 2008, the liquidity injections led to short term spikes but no lasting impact on the market. I am willing to speculate that the LTRO response with follow suit.

Capital Ratios an other impediments

Another FT article, this time referring to Richard Koo of Nomura, speculated similarly.  Koo is talking specifically about the impact of the 9% capital ratio, but as he alludes to, there are a number of factors producing the same basic effect on banks: new capital is used to assist in de-leveraging, not growing:

What is preventing the funds supplied by the ECB from flowing into the real economy and improving economic conditions? Although there are a number of answers, the biggest obstacle from a policy perspective is the European Banking Authority’s tough new capital rules.

The EBA has demanded that European banks raise core Tier 1 capital to 9% of risk-weighted assets by June 2012. None of the policies unveiled in response to the crisis has been so counterproductive…This 9% rule effectively prescribes the size of European banks’ balance sheets. This means banks will not be able to increase lending no matter how much liquidity the ECB supplies, effectively rendering any monetary accommodation by the ECB powerless to stimulate the economy. The EBA’s 9% rule may help in preventing the next crisis, but it will do nothing to resolve the current one—in fact, it will make it much worse.

Yields in Portugal aren’t falling

On a related note, one of the most interesting developments over the past month is that the Portugese 10 year yield has NOT fallen.

Investors aren’t being totally fooled by the LTRO.

In the next few months we should start to get a better picture about the impact of the austerity measures on the economies of Greece, Portugal, Italy and Spain.  I would speculate the numbers will be grim, and a lot of the wind provided by the LTRO will be knocked from the sails.

Bringing it all back home (to the portfolio moves)

As you know, I continue to hold a couple shorts of European banks.    I also added more gold stocks yesterday (specifically ABX and more OGC)  after the Fed news so these banks shorts could be seen as a bit of a hedge on my rather large gold stock position.

The other day I was contemplating some of my positions which had begun to move against me.  A lot of that has cleared in my head over the last few days.  The Fed announcement brought back my conviction in gold stocks.  And after taking a long and hard look at Europe, I have decided that I am likely on the right side of this bet, and while I would be wary of adding too much to that bet as the market moves against me, its not time to cut it just because of a few tough weeks.

The biggest thing that I think I have to remain wary of is that the ECB holds the trump card here.  A true QE style of bailout in the neighbourhood of E2B to E5B would truly push the problem so far out that it would be someone else’s worry.   Today’s announcement by the Fed to keep rates low for much longer than most anticipated could be seen as a step towards that.  At the end of the day, realizing that the LTRO is not the QE that everyone seems to be interpreting it as leaves an open question: is the QE still to come?